Customize Your Environment
Optic allows you to customize your user environment to best support your analysis tasks. You can even create and manage separate user environments - known as Workspaces - for different projects or different kinds of research. You can learn more about Workspaces in the Workspaces Tool section.
You can configure some customizations to your Workspace through the Workspaces Tool. Other settings are automatically saved to your Workspace as you work. These include:
Your Research Tool - Tabular Display Mode columns layout
Your Storm query bar mode (e.g., Lookup, Storm, etc.)
The current state of each display mode (e.g., Tabular, Force Graph, etc.)
Your query history in the Research and Console Tools for each query mode
Workspaces Tool
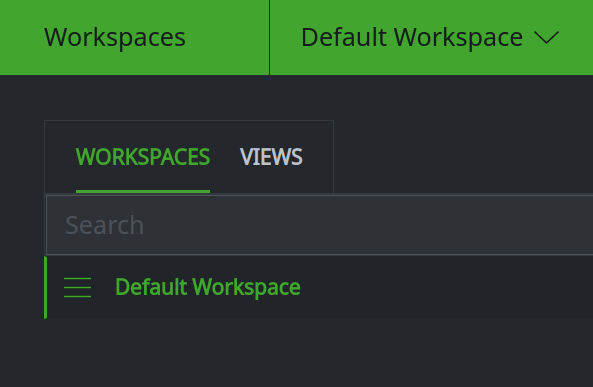
The Workspaces Tool can be accessed from the Optic Toolbar:
To customize aspects of your Workspace, select the WORKSPACES tab:
Set your tag color preferences
In Synapse, tags are “labels” that can be applied to nodes to provide context or group related objects together. You can use tag color rules to indicate that nodes with particular tags should be displayed in color to provide visual cues and situational awareness.
Tag color rules are ordered, with rules higher in the list taking precedence over rules lower in the list.
In the WORKSPACES tab, from the Workspaces list view, select the Workspace you wish to customize:

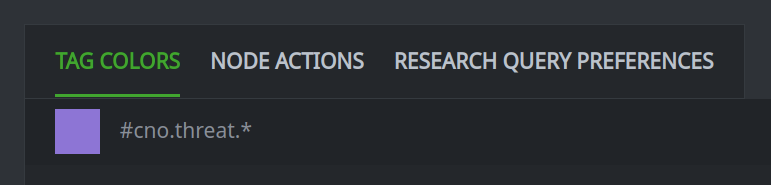
In the Workspace Preferences panel, select the TAG COLORS tab:

In the Add Tag Color input form, in the tag (foo.bar) field, enter the name of the tag you want to colorize (such as
my.tag). You can also specify a tag glob pattern using single (*) or double (**) asterisk (e.g.,my.tag.*.malwareorcno.vert**).In the color (green) field, enter the name of the HTML color you want to use for the tag color.
You can also click the colored square next to the color field and specify any of the following for the tag color:
RGB values
HSL values
Hex values (use
#00AA00for “Vertex green”!)
Or, you can click a location on the color map to auto-fill the values for your selected color.
Click the + Add Color button to add the tag color rule:
Once added, the new tag color rule will appear in the TAG COLORS list view:
Tip
Once a tag color rule is set, you cannot change the tag name / pattern or the color value. To change these settings you must delete the tag color rule and create a new one.
To change the order of your tag rules, click and hold the tag rule you want to move and drag it to its new location:
Note
If a node has more than one tag with an associated tag color rule, the rule highest in the TAG COLORS list view will take precedence.
Change the default number of results displayed
For each of Synapse’s Display Modes, you can specify the number of results to display.
In the WORKSPACES tab, from the Workspaces list view, select the Workspace you wish to customize:

In the Workspace Preferences panel, select the RESEARCH QUERY PREFERENCES tab:

Double-click the value you want to change. Enter the new value and press Enter to save the value:
Tip
The load increment is the number of results that will be returned before Synapse will pause and prompt you to continue loading additional results.
The display max is the maximum number of results Synapse will display in the specified display mode.
Create a custom Node Action
In the Workspaces Tool, select the WORKSPACES tab. From the Workspaces list view, select the Workspace you wish to customize:

In the Workspace Preferences panel, select the NODE ACTIONS tab:

In the Add Node Action input form, in the name field, specify a name for your Node Action.
In the query field, enter the Storm that the Node Action should run.
In the formtypes field, enter the name of the form (or forms) the Node Action should apply to. (Leave this field blank if the Node Action should apply to / be available for all forms.)
By default, your Node Action will run in the background, and the results displayed in Synapse will not be updated. If you want Synapse to return the results of running the Node Action, toggle the Render Nodes yielded from Action? switch to ON.
Click the + Add Action button to create the Node Action:
The new Node Action will appear on the NODE ACTIONS tab:
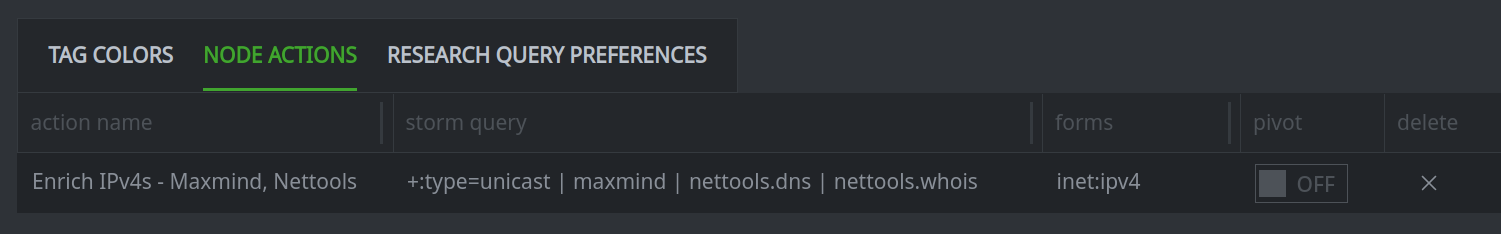
When using this Workspace in the Research Tool, the Node Action will be available from your right-click context menu (under actions >) for the forms you specified (or for all forms, if you did not specify any).
Tip
Node Actions cannot be modified once they are created. If you need to change a Node Action, you must delete the original Node Action and create a new one.
Set initial Workspace default preferences
These settings allow you to specify the default Storm query bar mode for both the Research Tool and the Console Tool, and the default display mode for the Research Tool. These settings apply to the first time a user selects and uses the Workspace. After that, any changes the user makes will persist, and these defaults will be ignored.
In the Workspaces Tool, select the WORKSPACES tab. From the Workspaces list view, select the Workspace you wish to customize:
In the Workspace Preferences panel, select the DEFAULT PREFERENCES tab:

Use the drop down menus to select the initial defaults:
Tip
Because these settings only apply once (the first time the user accesses the Workspace), they are most useful when pre-configuring a Workspace that will be shared with other users. See the Workspaces Tool section for information on shared Workspaces and Global Default Workspaces.
Research Tool - Tabular Display Mode
In Tabular mode, Synapse displays each form’s primary property in the Results Panel by default. You can customize the data Synapse displays for each form, including:
properties;
tags;
tag timestamps;
properties from related / adjacent nodes;
arbitrary data specified by a variable.
Your column layouts are automatically saved as part of your active Workspace.
Display selected properties in columns
There are two primary ways to configure property columns: using the Details Panel and using the Edit Columns dialog.
Note
When adding a new column, the column is always inserted as the right-most column. The exception is a node’s primary property, which is always inserted as the left-most column. See Change the order of my columns to reorder your columns.
Add or remove a property using the Details Panel
Configuring properties using the Details Panel provides a fast and easy way to add or remove columns.
In the Results Panel, select a node for the form you want to configure.
View the node’s properties in the Details Panel.
Toggle the dot to the left of any property name to add or remove it from the display:
Toggle the dot to green to add it to the Results Panel.
Toggle the dot to gray to remove it from the Results Panel.
Tip
In the Details Panel, use the NODE tab to:
toggle the display of the form’s primary property;
toggle the display of any property that is set for your selected node; or
toggle the display of the timestamps for any tag on the node.
Use the ALL PROPS tab to:
toggle the display of any property for that form, even if the property is not currently set.
Add a property using the Edit Columns dialog
The Edit Columns dialog provides greater flexibility and more options for configuring your columns.
In the Results Panel, click the hamburger menu next to the name of the form you want to configure and choose Edit Columns from the menu.

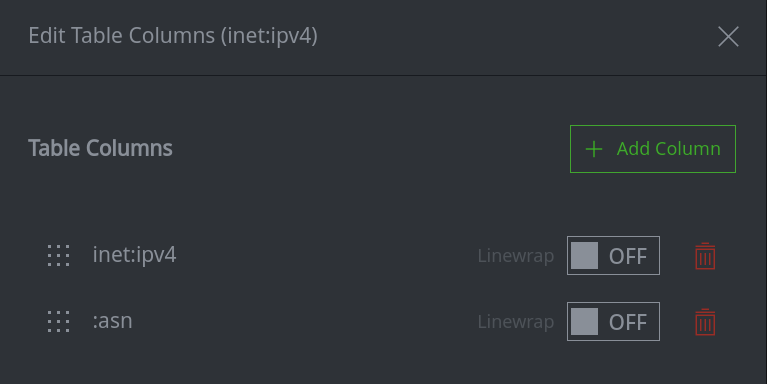
In the Edit Table Columns dialog, click the + Add Column button.
In the Add Table Column dialog, from the Column Type dropdown list, select Property.
Select the property you wish to add from the dropdown list of available properties for that form.
Click the Save button to add the property and return to the Edit Table Columns dialog.
The new property will be visible in the Edit Table Columns dialog. Click the X to close the dialog.
Remove a property using the Edit Columns dialog
In the Results Panel, click the hamburger menu next to the name of the form you want to configure and choose Edit Columns from the menu.

In the Edit Table Columns dialog, click the trash can icon next to the property you wish to remove.
Click the X to close the Edit Table Columns dialog.
Tip
Use this process to remove any type of column (e.g., property, tag, tag glob, or embed).
To quickly remove a column, you can also left-click the column header in the Research Tool and select hide X from the column header menu.
Display tag timestamps as columns
This process adds tag timestamps to a single form that you specify. To add tag timestamps to all forms that have the tag, see Display a specific property, tag timestamp, or tag for all forms.
In the Results Panel, click the hamburger menu next to the name of the form you want to configure and choose Edit Columns from the menu.
In the Edit Table Columns dialog, click the + Add Column button.
In the Add Table Column dialog, from the Column Type dropdown list, select Tag.
Enter the name of the specific tag whose timestamps you want to add as columns.
Click the Save button to add the timestamps and return to the Edit Table Columns dialog.
The new tag whose timestamps will be displayed will be visible in the Edit Table Columns dialog. Click the X to close the dialog.
Tip
You can only display timestamps associated with a single tag. You cannot use wildcard syntax to specify “timestamps for any tag that matches this pattern”.
You can also add tag timestamps by toggling the dot next to the tag in the Details Panel.
Display tags in a column
This process adds a tag (or tags) to a single form that you specify. To add tags to all forms that have the tag, see Display a specific property, tag timestamp, or tag for all forms.
In the Results Panel, click the hamburger menu next to the name of the form you want to configure and choose Edit Columns from the menu.
In the Edit Table Columns dialog, click the + Add Column button.
In the Add Table Column dialog, from the Column Type dropdown list, select Tag glob.
Enter the name (or pattern, using the wildcard / asterisk) for the tag(s) you want to display.
Click the Save button to add the tag(s) and return to the Edit Table Columns dialog.
The new tag (or tag glob) will be visible in the Edit Table Columns dialog. Click the X to close the dialog.
Display a property from a “nearby” node in a column (embed column)
An embed column allows you to display a property from an adjacent node in the columns for a given form. This can provide additional context for the displayed node without having to explicitly pivot (or explore) to view the adjacent node.
You must use Storm’s embedded property syntax to specify the embedded property to add.
In the Results Panel, click the hamburger menu next to the name of the form you want to configure and choose Edit Columns from the menu.
In the Edit Table Columns dialog, click the + Add Column button.
In the Add Table Column dialog, from the Column Type dropdown list, select Embed.
Enter the embedded property syntax expression that references the adjacent property you want to display.
Click the Save button to add the embedded property and return to the Edit Table Columns dialog.
The embed column will be visible in the Edit Table Columns dialog. Click the X to close the dialog.
Note
You will need to refresh your Results Panel in order to populate the values in the embed column.
If your results were obtained from a Storm query, re-run the query.
If your results were obtained by using the Explore button to navigate, go back one step in your breadcrumbs and re-navigate to the results.
Display arbitrary data in a column (path variable column)
You can display arbitrary data in a column by defining the data as a variable (path variable or “path var”) within a Storm query.
Tip
Path vars are a useful (but specialized) way to modify your Tabular mode layout and may require familiarity with some of Storm’s more advanced concepts. One example use case for path vars is to generate a custom table layout for import into a report using Synapse’s Stories Tool. We will demonstrate how to configure a path var column and then provide a few examples for how to use Storm to populate the column(s).
In the Results Panel, click the hamburger menu next to the name of the form you want to configure and choose Edit Columns from the menu.
In the Edit Table Columns dialog, click the + Add Column button.
In the Add Table Column dialog, from the Column Type dropdown list, select Path var.
In the variable name (myvarname) field, enter the name of your variable.
In the representation (repr type (optional)) field, enter the type of the data to be displayed (if needed).
Click the Save button to add the path var column and return to the Edit Table Columns dialog.
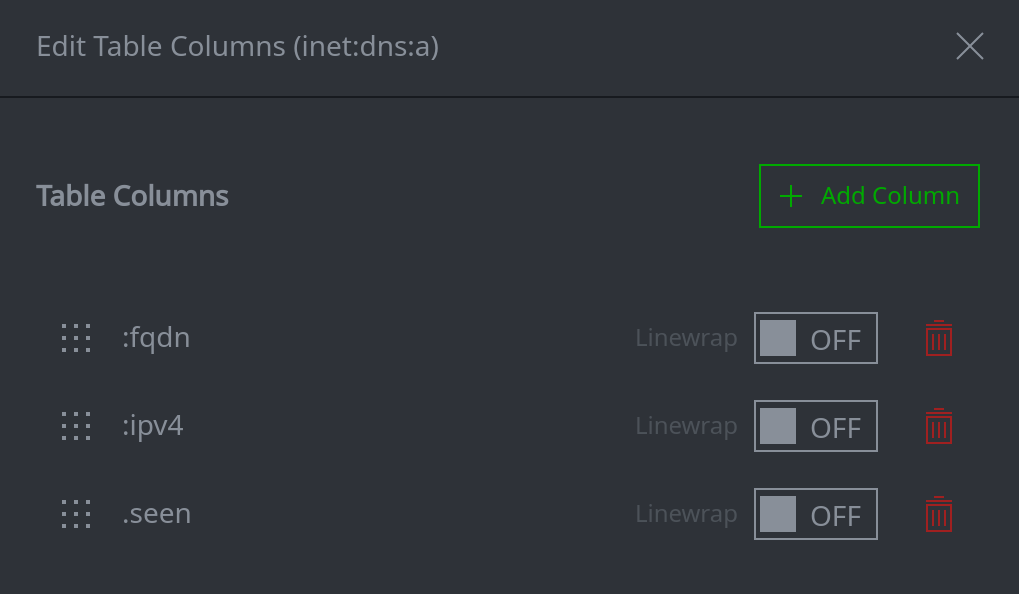
The path var column will be visible in the Edit Table Columns dialog. Click the X to close the dialog.
Tip
Specifying a repr type is optional. This setting is needed if Synapse stores the data specified by your variable in a “non-human friendly” format and you want the “human friendly representation” to be shown in the column. For example, Synapse stores IPv4 addresses as integers. Specifying
inet:ipv4as the repr type will display the column’s data in “human friendly” dotted decimal notation.You can add, remove, or modify the repr type at any time by returning to the Edit Table Columns dialog.
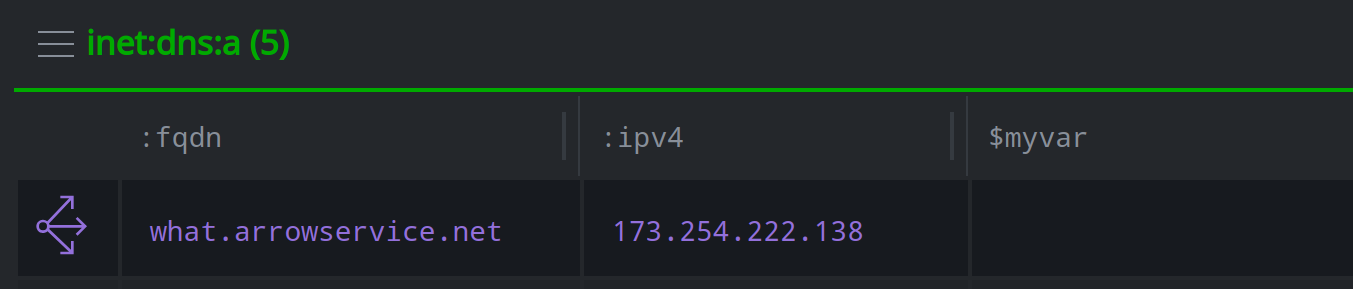
The column will now be visible in the associated table in the Results Panel:
Populating Path Variables
To populate columns using path variables, you need to:
Define path var columns for the values you want to project.
Construct a Storm query to navigate to the nodes/properties/tags you want to use for the column values. (You can use subqueries to reach the data you need without navigating away from the current nodes in the Storm pipeline.)
Define your variables.
Create a
$path.meta.*assignment statement to assign each variable to its associated column.Run your Storm query.
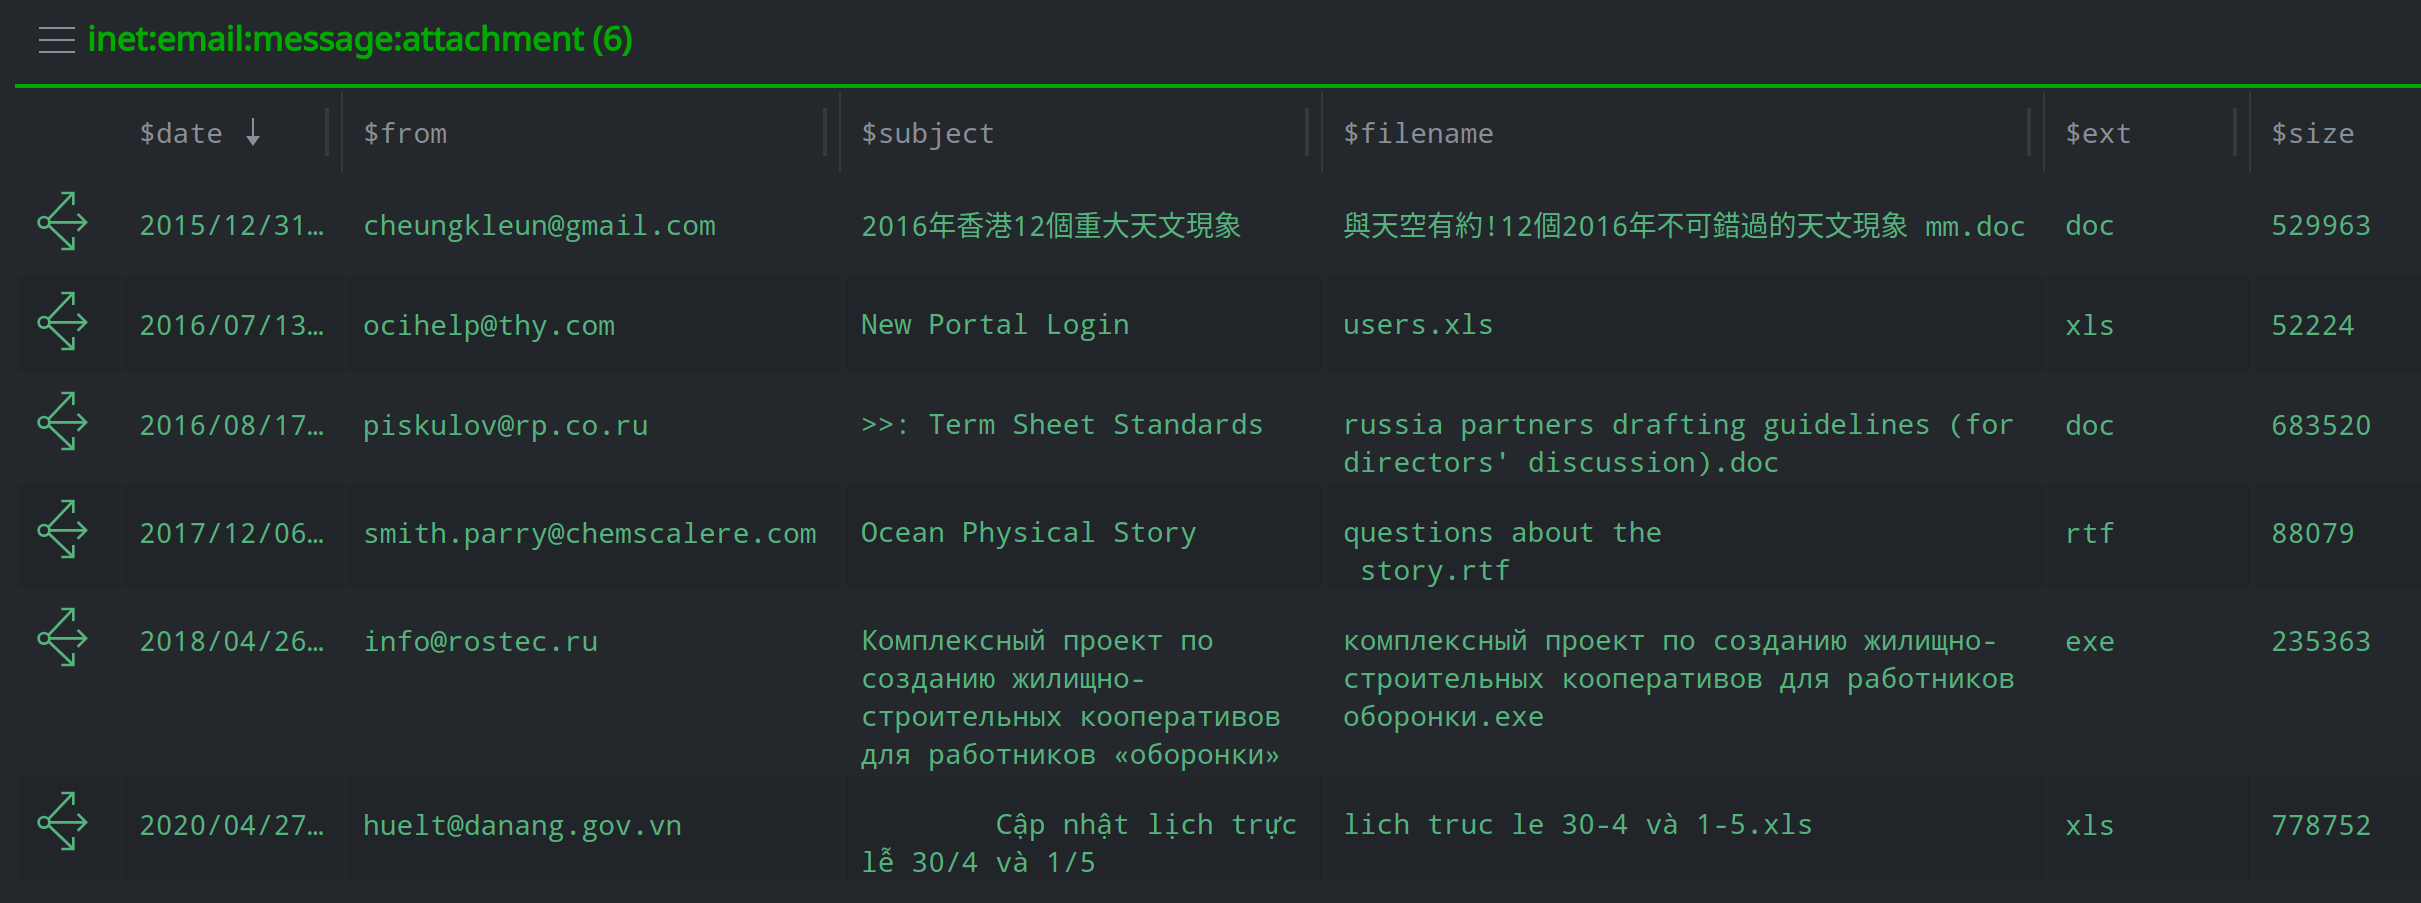
Example 1
An inet:email:message:attachment node links an inet:email:message with a file (file:bytes) that was attached to
the message. You are looking at historical spear phishing messages from a particular threat group and want to create a custom
table that displays specific properties from both the inet:email:message (date, from, subject) and the attachment’s
file:bytes (file name, file extension, size).
Once I define my path var columns I can use the following Storm query to:
Lift the
inet:email:message:attachmentnodes for the threat group.Use subqueries to pivot to the relevant nodes and set variables.
Set the necessary
$path.meta.*assignments.inet:email:message:attachment#cno.threat.viciouswombat { -> inet:email:message $date=:date $from=:from $subject=:subject } { -> file:bytes $size=:size $filename=:name } { -> file:bytes :name -> file:base $ext=:ext } $path.meta.date=$date $path.meta.from=$from $path.meta.subject=$subject $path.meta.filename=$filename $path.meta.ext=$ext $path.meta.size=$size
When I run the query above, I get the following results:
Example 2
An inet:dns:a node combines an FQDN with the IPv4 address the FQDN resolved to. You want to create a custom table that displays
the FQDN and IPv4 from the inet:dns:a node as well as all of the tags from the associated inet:fqdn and inet:ipv4 nodes
(fqdntags and iptags), respectively.
Once I define my path var columns (using syn:tag as my repr type), I can use the following Storm query to lift my inet:dns:a
nodes, collect the tags from the FQDNs and IPv4s, and project them into my table:
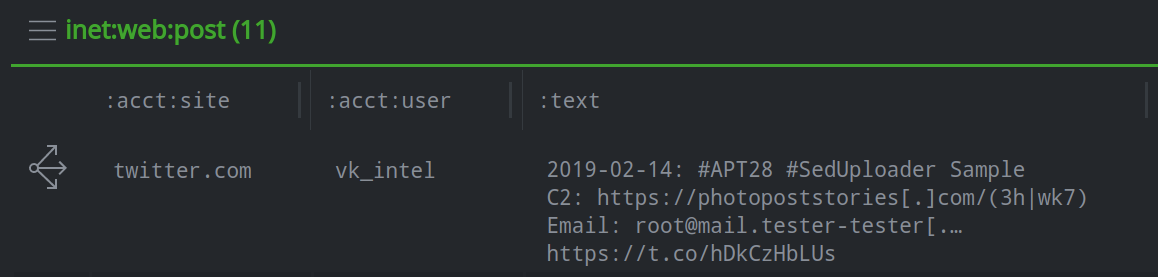
inet:dns:a#my.tag

$fqdntags = ()
$iptags = ()

{
    :fqdn -> inet:fqdn
    for $tag in $node.tags(leaf=$lib.true) { $fqdntags.append($tag) }
}

{
    :ipv4 -> inet:ipv4
    for $tag in $node.tags(leaf=$lib.true) { $iptags.append($tag) }
}

$path.meta.fqdntags = $fqdntags
$path.meta.iptags = $iptags
Our results:
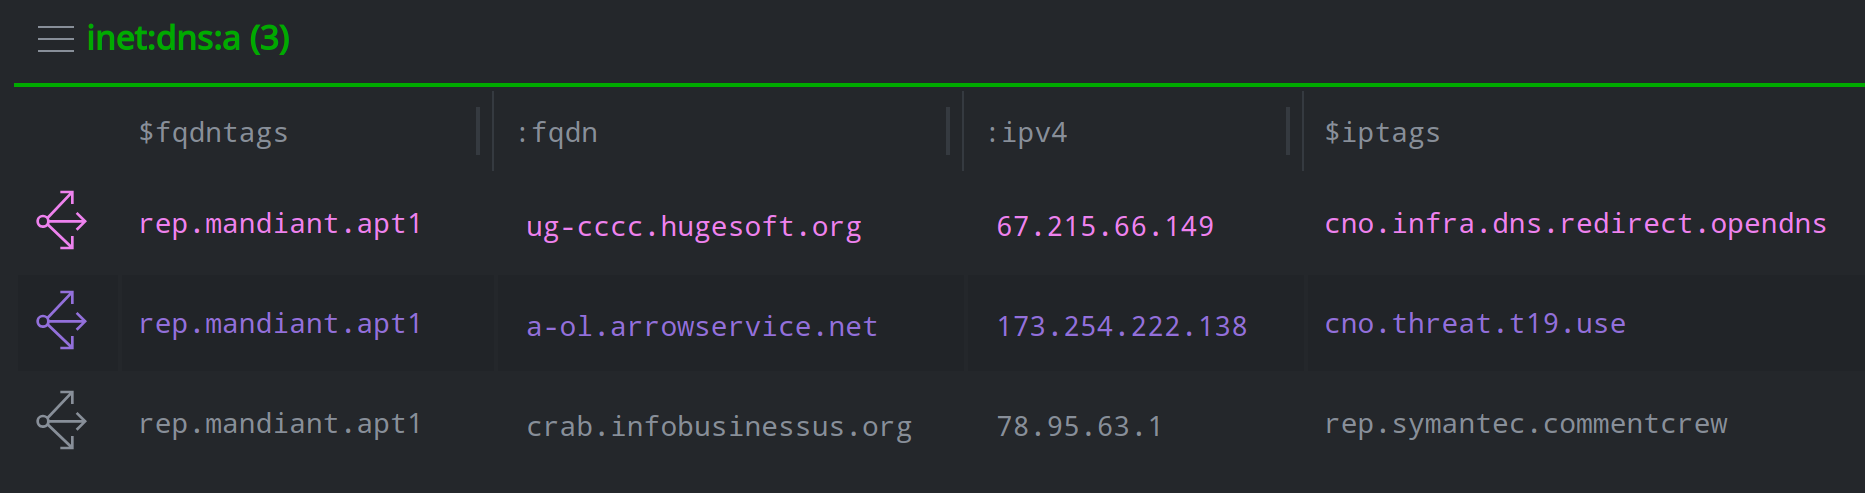
Tip
Specifying $node.tags(leaf=$lib.true) in the query above will collect and display only the longest (leaf) tag for any tag
path / tree. This means that our results will only display the tag rep.mandiant.apt1 instead of rep, rep.mandiant, rep.mandiant.apt1.
Display a specific property, tag timestamp, or tag for all forms
This process allows you to specify that a property, tag, or tag timestamps should be displayed for any / all forms where the item is present.
1. In Tabular mode, click the display mode hamburger menu (to the far right of the display mode selector, next to the Scroll to Form dropdown) and choose Edit global columns.
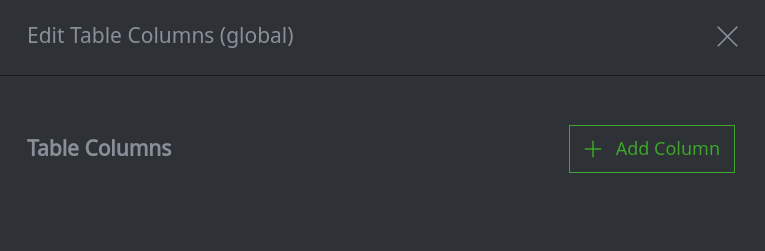
In the Edit Table Columns (global) dialog, click the + Add Column button.
In the Add Table Column (global) dialog, from the Column Type dropdown list, select the type of column you wish to add:
Property (see Add a property using the Edit Columns dialog)
Tag (for tag timestamps - see Display tag timestamps as columns)
Tag glob (for tags - see Display tags in a column)
Follow the relevant instructions under the links above to configure the column.
Tip
If you are adding a property, only universal properties are present across all forms, so you can only select
.seenor.createdwhen specifying a global property column.
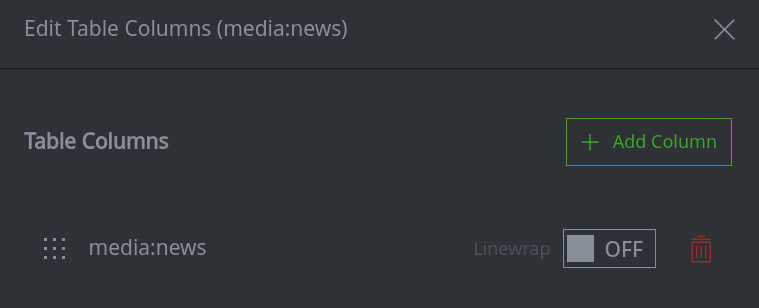
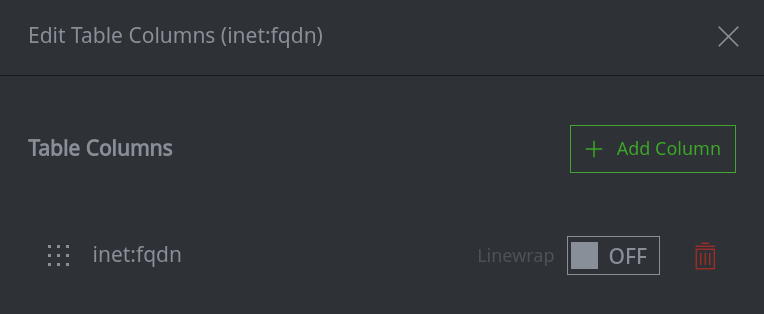
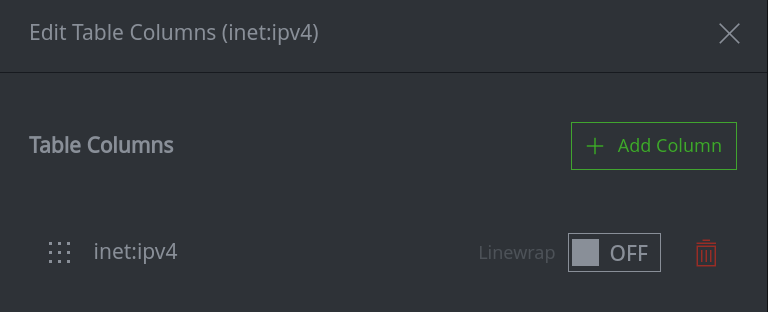
Use line wrapping to display long property or tag values
In the Results Panel, click the hamburger menu next to the name of the form you want to configure and choose Edit Columns from the menu.
In the Edit Table Columns dialog, toggle the Linewrap switch to the ON position for the column whose values you want to wrap.
Click the X to close the Edit Table Columns dialog.
The specified column will now wrap based on the column width.
Change the order of my columns
In the Results Panel, click the hamburger menu next to the name of the form whose columns you want to configure and choose Edit Columns from the menu.
In the Edit Table Columns dialog, click and hold the column you want to reorder and drag it to the desired position.
Click the X to close the Edit Table Columns dialog.
Reset columns to their original settings
In the Results Panel, click the hamburger menu next to the name of the form whose columns you want to reset and choose Reset all columns from the menu.
This returns the form to its default settings (i.e., only the form’s primary property is displayed).
Tip
Choosing Reset tag columns will reset (remove) any tag timestamp columns.