Quick Tour
This Quick Tour provides an overview of Optic’s main UI elements and navigation features.
Tip
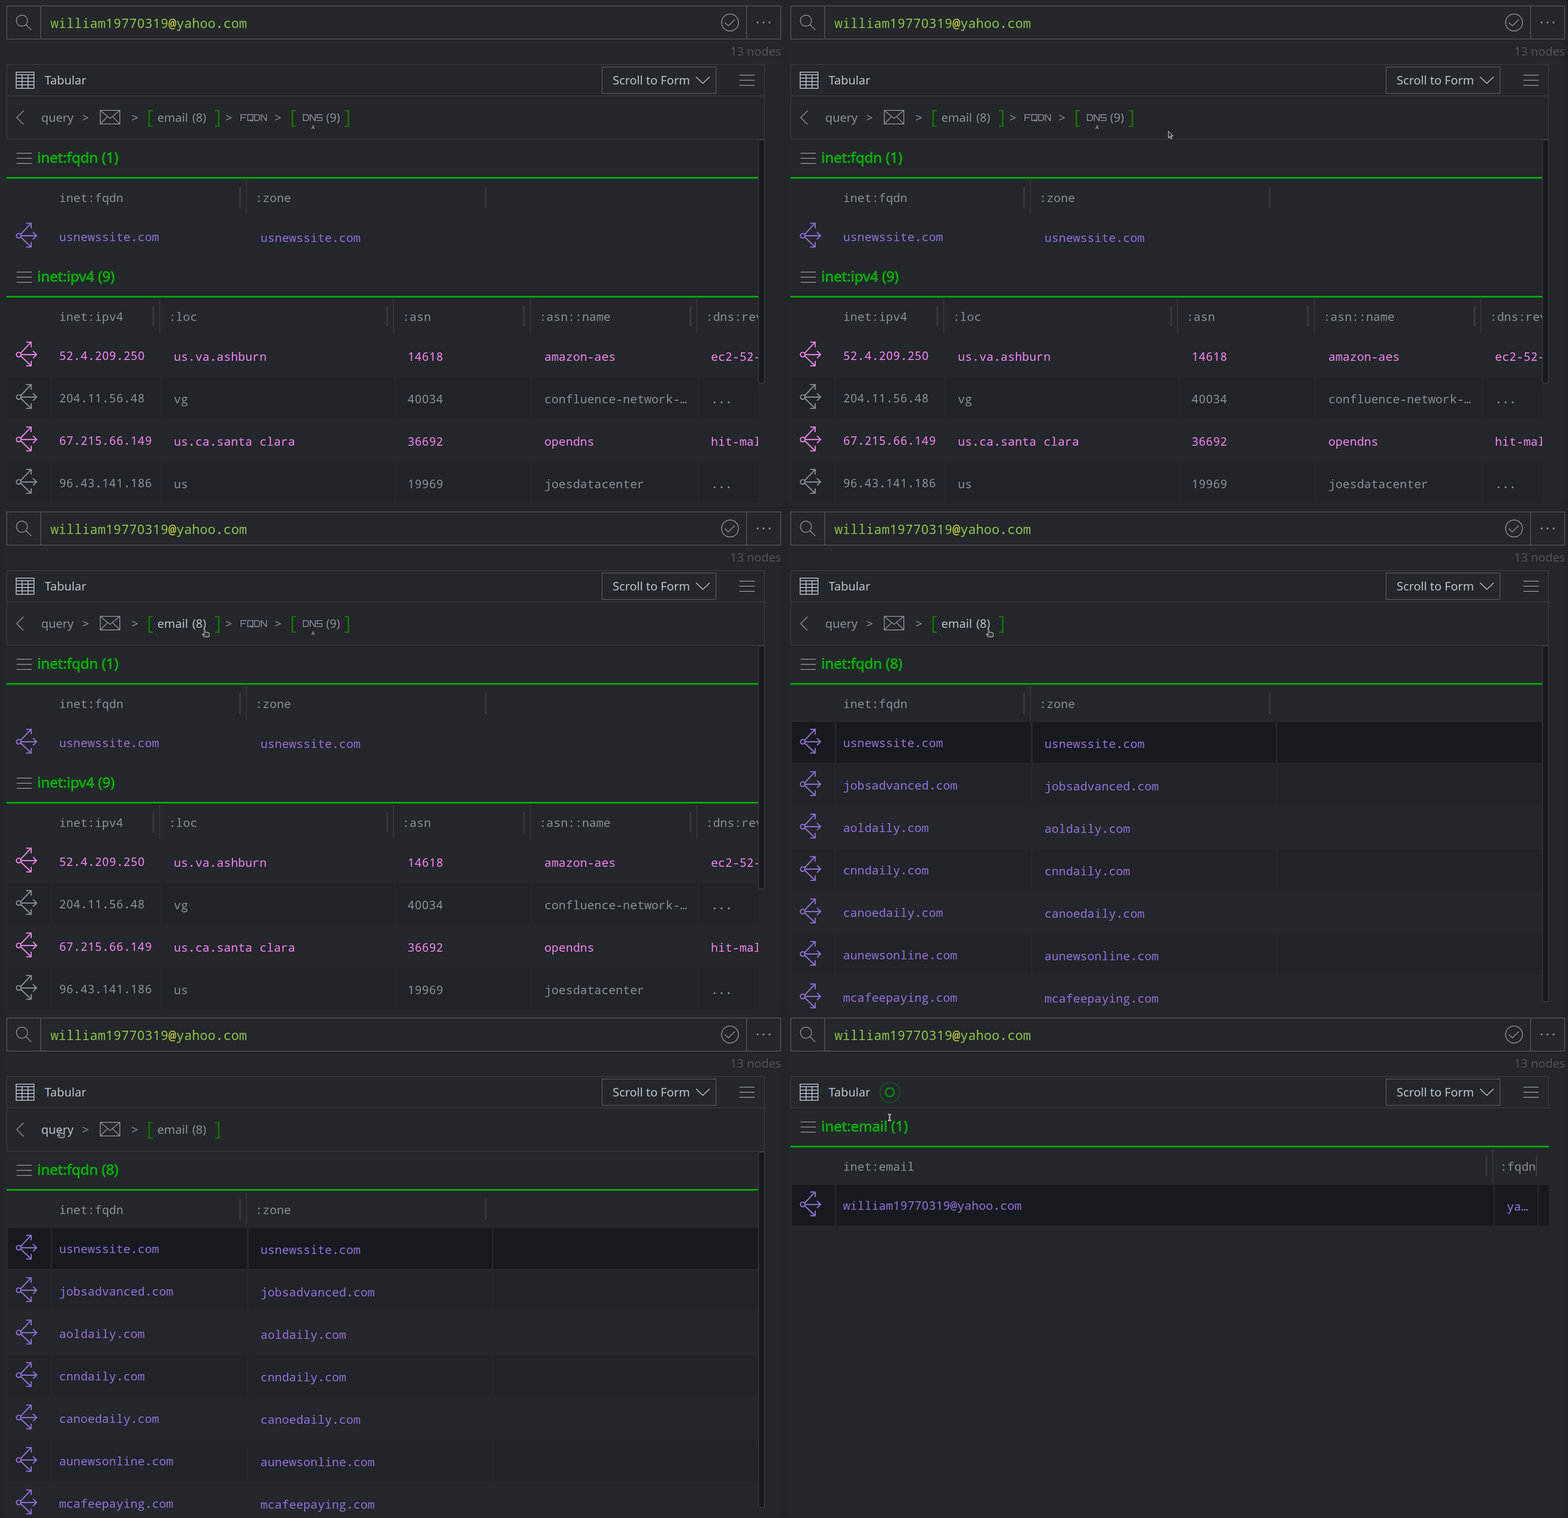
The Research Tool is the primary tool used to interact with Synapse. See the Navigation Basics section below for some fundamentals on interacting with Synapse through the Research Tool.
Top Bar
The green Top Bar provides an overview of your current environment and allows you to select or change various environment settings.
From left to right, the Top Bar includes the following:
Tool Indicator
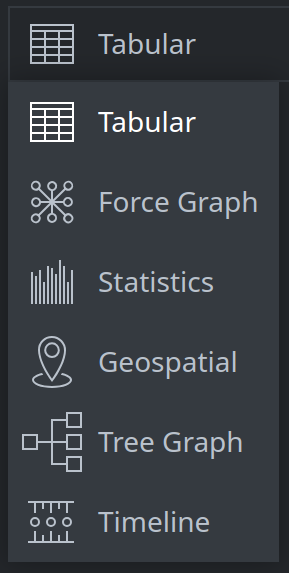
The Tool Indicator displays the name of the active Tool (as selected from the Toolbar):

Workspace Selector
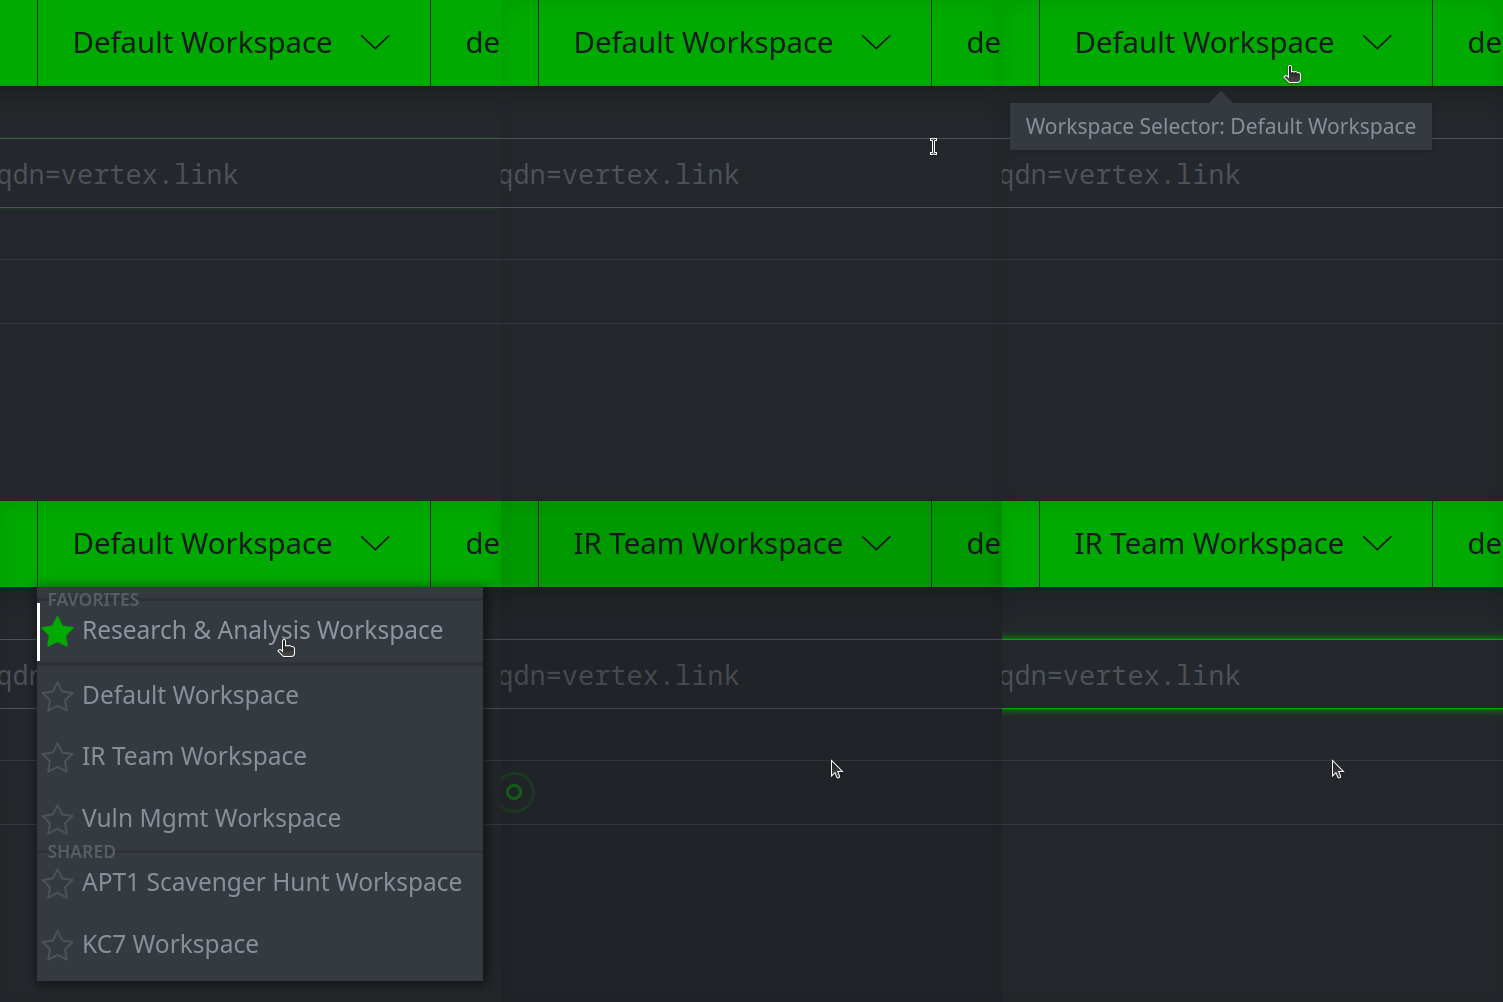
The Workplace Selector displays the active Workspace and allows you to select / change the Workspace in use or manage your favorite Workspaces:
Tip
See the Workspaces Tool for more information on Workspaces.
View Selector
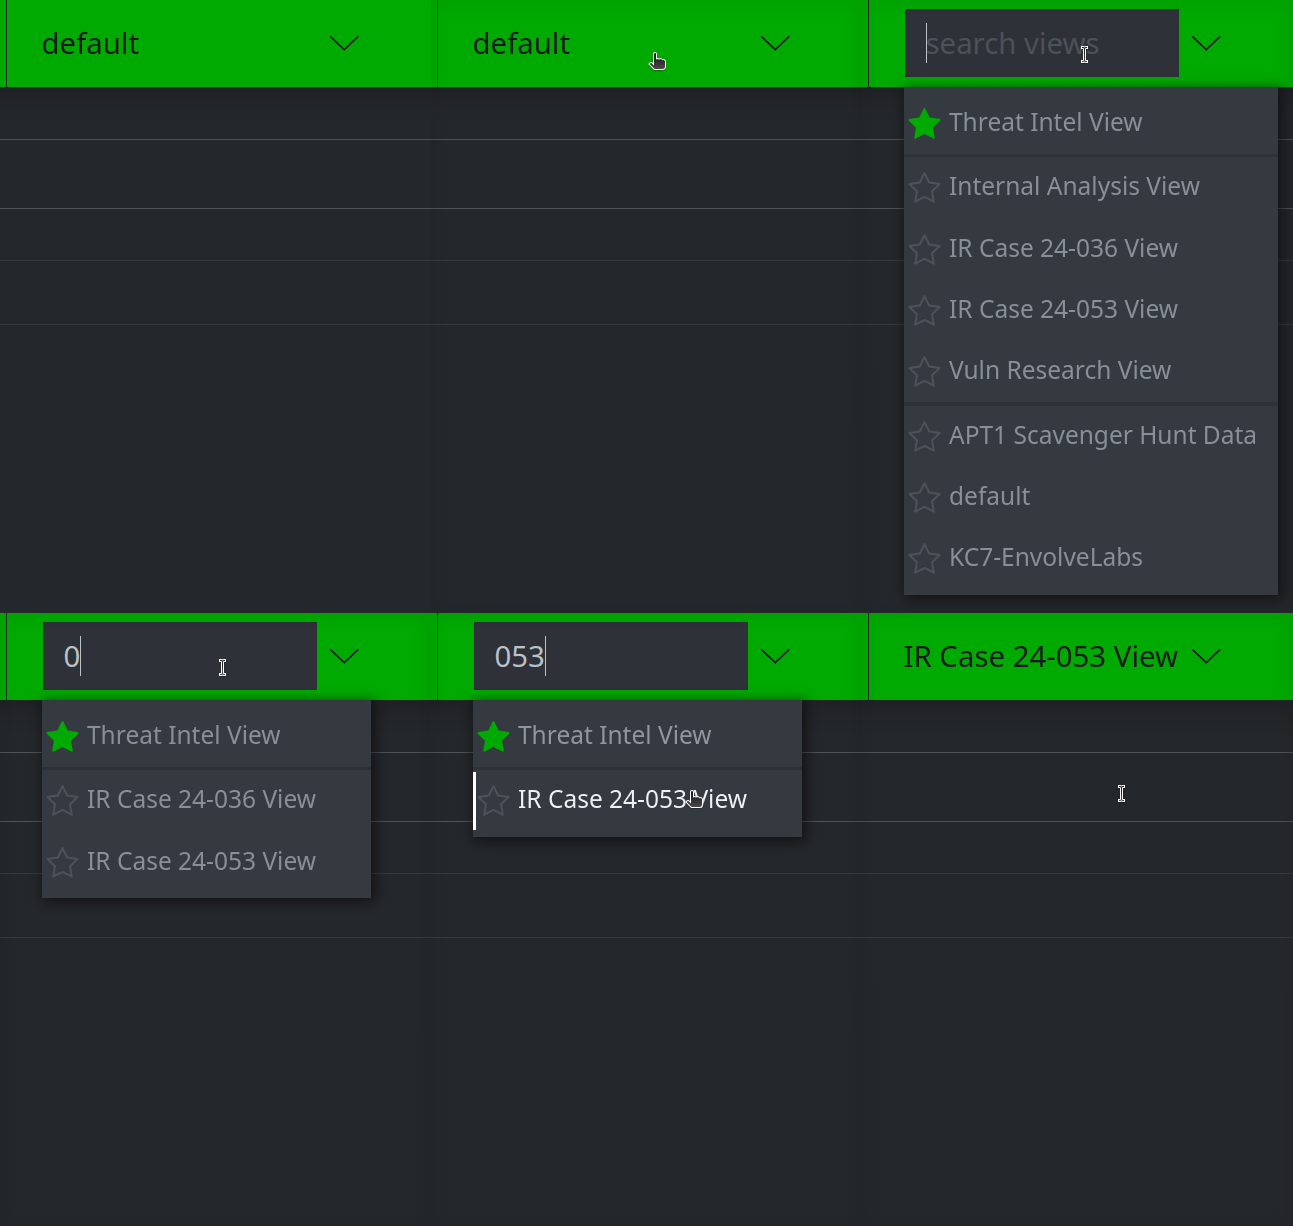
The View Selector displays the active view and allows you to search and select / change the view in use or manage your favorite views:
View Task Bar
The View Task Bar allows you to perform basic view management tasks: fork a view, view the differences / changes between the current view and the underlying view, merge the current view into the underlying view, or delete the current view.

Tip
See the Views and Layers section for more information on working with views in Synapse.
Notifications Icon
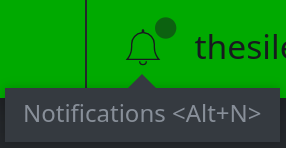
The Notifications Icon indicates whether notifications are available. A gray dot will appear next to the icon when you have notifications. Click the icon to view any messages.
Your Settings
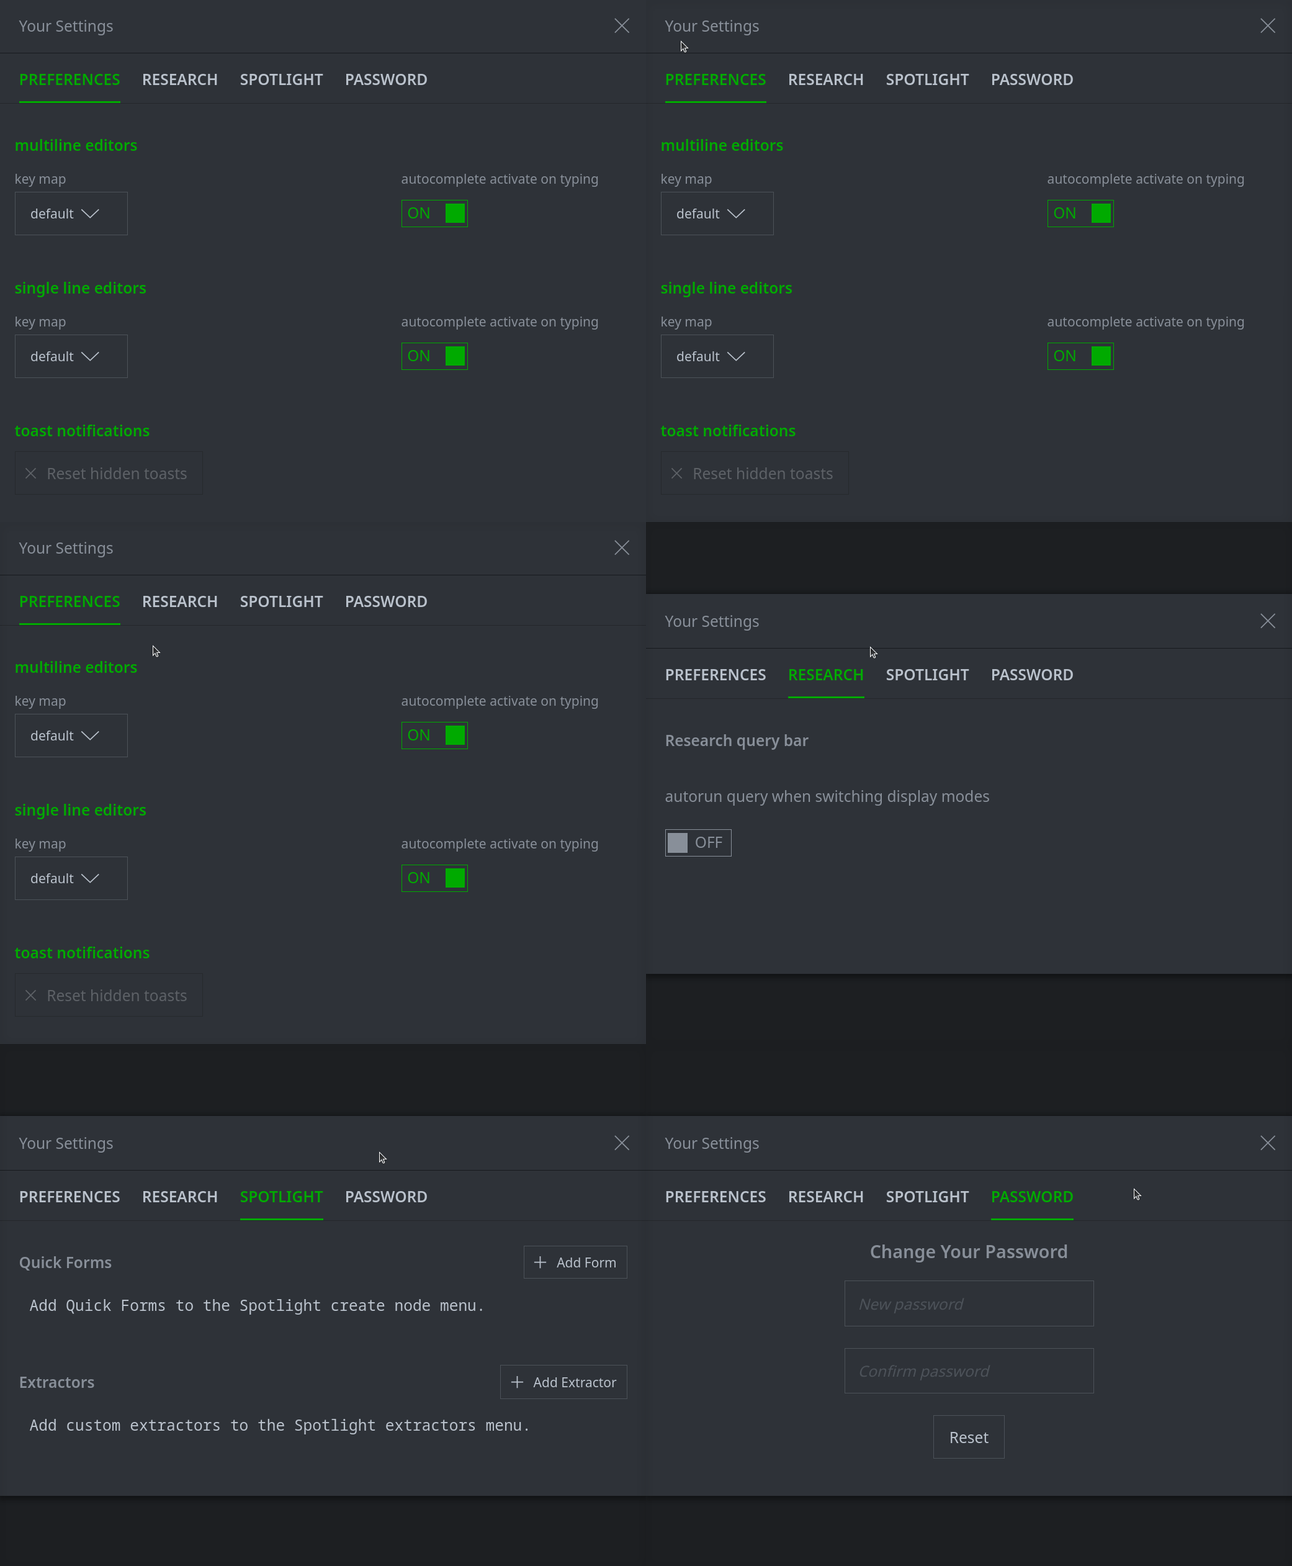
Your Settings displays your username; clicking this area will open a dialog for various user configuration options:

Use the Your Settings dialog to set user options for features such as autocomplete or Spotlight Tool customizations, or to change your password:
Logout
The Logout icon (the X next to Your Settings) logs you out of Synapse.

Toolbar
The vertical Toolbar on the left provides easy access to Synapse’s Tools.
Use the double arrows next to the Admin Tool to expand or collapse the Toolbar:

Research Tool
The Research Tool is the primary tool analysts use to query, navigate, and visualize data in Synapse.

Spotlight Tool
The Spotlight Tool is used to load and view HTML or PDF reports and to view and extract indicators and other information.

Ingest Tool
The Ingest Tool is used to load, view, and import data into Synapse from CSV, JSON, or JSONL formatted files.

Storm Editor Tool
The Storm Editor Tool provides a development environment to create, test, and save Storm queries, Storm macros, and other Storm code.

Stories Tool
The Stories Tool is used to collaborate on and create finished reporting from data in Synapse, either as one-time reports or generated on demand from a template.

Workflows Tool
The Workflows Tool provides access to Synapse Workflows. A Workflow is a custom UI interface tailored to a specific task.

Console Tool
The Console Tool provides CLI access to Synapse command help and is used to view status, warning, or error messages. It also includes a Storm query bar and can be used to run Storm queries or commands.

Workspaces Tool
The Workspaces Tool allows users to manage various aspects of their user environment, including customizing your environment and displaying and managing available views.

Power-Ups Tool
The Power-Ups Tool allows users to view information about installed and available Power-Ups and to manage (install, update, or remove) Rapid Power-Ups (with appropriate permissions).

Metrics Tool
The Metrics Tool provides a dashboard for viewing changes (node edits) made over time to a view, layer, or the overall Synapse data store (Cortex).

Help Tool
The Help Tool provides access to useful features such as the Data Model Explorer and Tag Explorer, and includes links to Synapse’s documentation.

Admin Tool
The Admin Tool is used for Synapse Admin tasks, such as managing users, roles, and permissions; views and layers; and automation such as cron jobs and triggers.


