Display Modes
Optic’s Research Tool provides various display modes so you can visualize your data in different ways. Many Research Tool features and options are consistent across all display modes; see the Navigation Basics section of the Optic Quick Tour for an overview of common features and menu options.
Tip
Use the Workspaces Tool to configure the number of results to show (as a load increment and a total value) for each display mode.
Select a Display Mode
Click the Display Mode Selector under the Storm query bar and select the display mode to use from the dropdown list.
Tip
When you change display modes, Synapse will preserve any query that is present in the query bar, but will not automatically re-run the query. Press Enter to re-run your query and display the results using the new display mode.
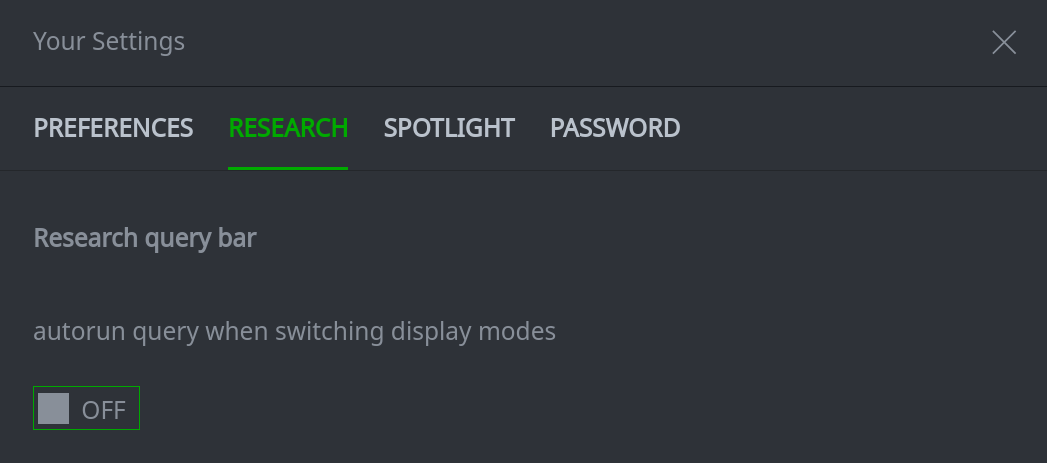
Automatically Re-Run Queries
You can configure Synapse to automatically re-run the current query when switching between display modes:
Click the Storm query bar menu (the three dots or “meatball menu”) on the right of the Storm query bar.
Select the checkbox next to the Autorun Query option.
Select / Deselect Nodes
Most display modes share a common set of menu options for selecting nodes. (Statistics display mode is the exception, because it displays summary data vs. individual nodes.)
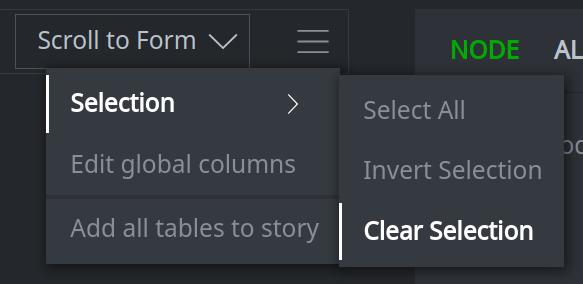
These options are available under the Selection > option on the display mode hamburger menu (the three lines to the far right of the Display Mode Selector):
Selection > Select All selects all the nodes displayed in the Results Panel:
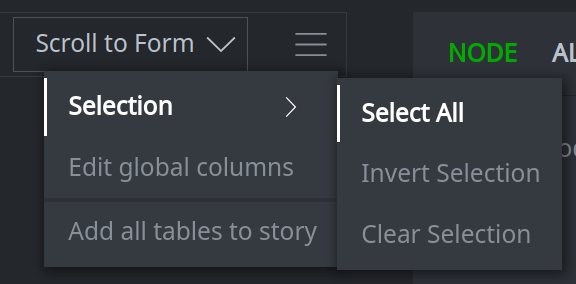
Selection > Invert Selection swaps your current selection (all selected nodes are deselected, and vice versa):
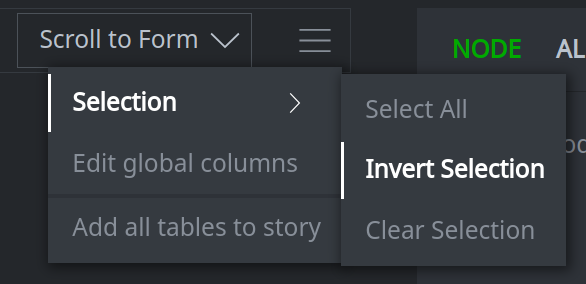
Selection > Clear Selection deselects any currently selected nodes:
Tip
The display mode hamburger menu may contain additional display mode-specific menu options, depending on your current display mode.
Tabular Display Mode
Tabular display mode (Tabular mode) allows you to visualize your data in a ‘rows and columns’ layout. It is most useful for:
easily viewing the data and tags in your results;
sorting results;
ad-hoc navigation or querying of the data;
exporting specific columns (as space- or newline-separated values) or tables (as CSV) of data.
If your results include different types of objects (forms), each form will have its own section or table in the Results Panel.
Tip
You can easily view a summary of your results or jump to a particular form using the Scroll to Form button.
Customize Your Tabular Mode Display
Every form in Synapse has its own set of properties - an IPv4 address is very different than a file. In addition, some forms have a large number of properties - too many to fit easily in one row of Tabular mode’s Results Panel. Finally, different properties (and tags!) may be more useful for different types of analysis.
You can fully customize the columns and / or tags displayed for each form in Tabular mode’s Results Panel. Any changes to the layout are saved as part of your current Workspace.
Tip
You can always view all of the properties and tags for a node by selecting the node in the Results Panel and viewing the full information in the Details Panel.
Details on configuring your Tabular mode layout can be found in the Research Tool - Tabular Display Mode section on how to Customize Your Environment.
Select Nodes in Tabular Mode
You can Select / Deselect Nodes using the menu options common to most display modes.
The following additional options apply to Tabular mode.
Select a Single Node
To select a single node, click the node in the Results Panel:

Tip
When selected, the node (row) background will change to a darker gray.
Select Multiple Nodes
Use shift-click to select a set of contiguous nodes or ctrl-click to select a set of arbitrary nodes:
Select All Nodes in Table
Click the hamburger menu next to the table header and choose Select all.

Explore Data in Tabular Mode
You can explore data in Tabular mode to identify other nodes that are “connected” (by shared properties or light edges) to the node(s) you explore from.
To explore from a node (or nodes), use any of the available methods to select / multi-select the nodes to explore from.
Click the Explore button next to any selected node:
Force Graph Display Mode
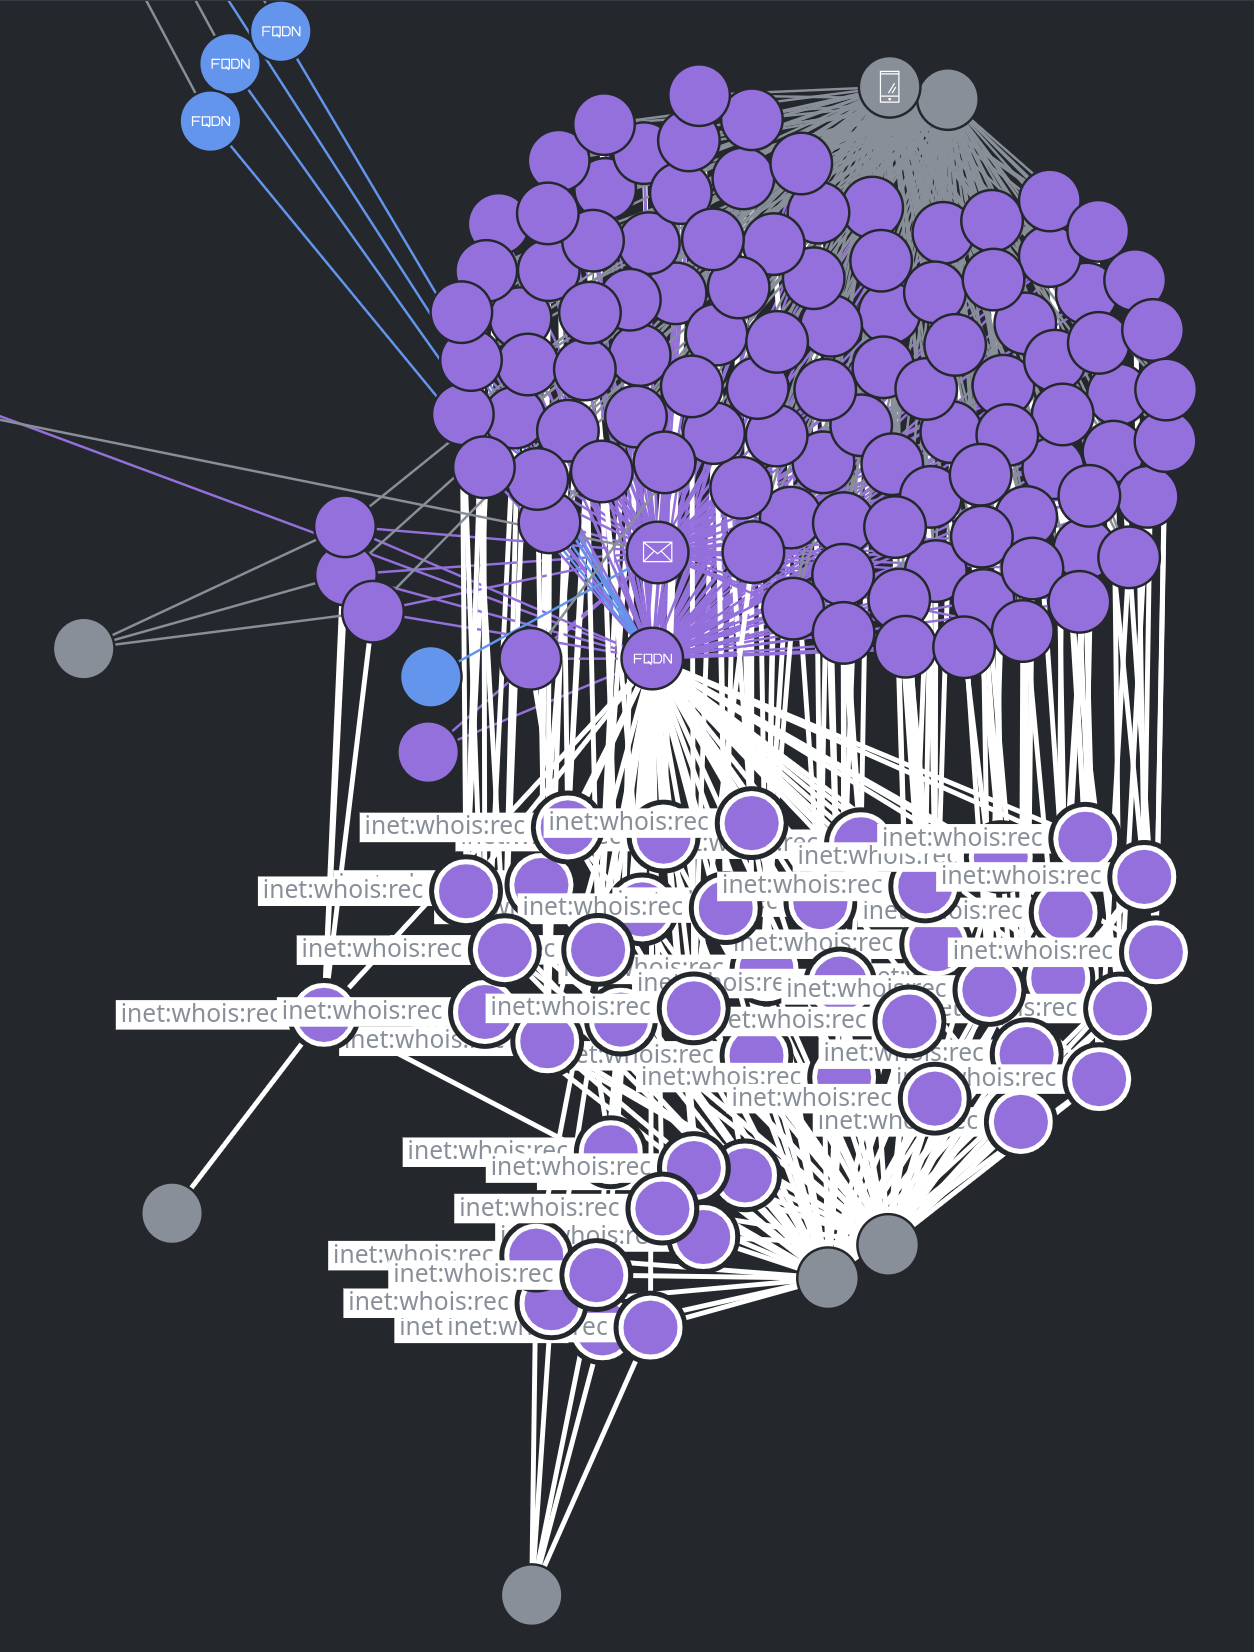
Force Graph display mode (Force Graph mode) allows you to visualize your results as a graph of objects (nodes) and relationships (“edges”). Once your graph is generated, you can:
When you run a query in Force Graph mode, Synapse displays the results according to a defined set of graph projection rules. The built-in default rules will display:
all the nodes returned by your query; and
a subset of nodes “one degree out” from your results (to help identify additional connections).
Because Synapse is a hypergraph (as opposed to a directed graph), Force Graph mode “flattens” the hypergraph into a “directed graph-like” display. Dots in the graph represent nodes, just as in a traditional directed graph. However, lines (“edges”) in Synapse’s Force Graph can represent various kinds of connections, including:
shared property values between nodes;
lightweight (light) edges that connect nodes; or
a defined path between nodes.
For example, using the built-in (default) graph projection:
an FQDN (
inet:fqdn) is linked to its DNS A record (inet:dns:a) by a line that represents the shared FQDN property value.the DNS A record is linked to its data source (
meta:source) by a line that represents the-(seen)>light edge.
Tip
You can use Custom Graph Projections to define the specific nodes, pivots, and relationships you want to display.
Pause or Play the Force Graph Physics
As your results are populated, Synapse uses a physics engine (algorithm) to find the optimal layout for your graph (“force graph” is short for “force-directed graph”). This means the nodes will move around on their own until they find equilibrium:

Pause Force Graph
Click the pause button to stop the force graph movement:
Play / Resume Force Graph
Click the play button to resume the force graph movement and allow the graph to redistribute:
Navigate the Force Graph
Use your pointing device (mouse or touchpad) to navigate the force graph.
Zoom In or Out
With your cursor in the Results Panel, use your device’s scroll function (e.g., the scroll wheel on a mouse) to zoom in and out:
Move the Force Graph
With your cursor in the Results Panel, click and hold while you use your device to move the force graph:
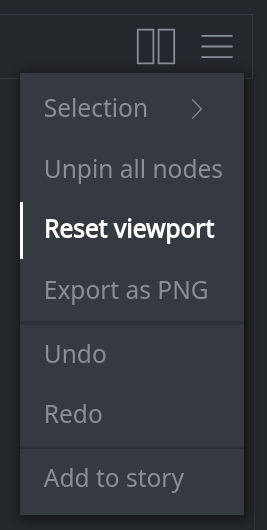
Reset the Force Graph’s Position
To return the force graph to its original position, click the force graph hamburger menu (the three lines next to the play/pause button) and select Reset viewport:
Tip
The Reset viewport option resets the position of your existing force graph. If you have modified your graph any changes are preserved when you reset the viewport.
To reset the entire graph (i.e., display your full, original results), re-run your query in the Storm query bar.
View Node Information
In the Results Panel, use your device to hover over any node to temporarily highlight the node and its edges/connections and to display a tooltip with basic information about the node:
Select Nodes in the Force Graph
Selecting nodes in Force Graph mode is similar to selecting nodes in other display modes. As always, selecting a node in the Results Panel displays the node’s details in the Details Panel, and you can Select / Deselect Nodes using the display mode menu options common to most display modes.
In Force Graph, selecting nodes is closely related to two additional display options:
Pinning (or unpinning) a node - fixing the node in place even when the physics engine is active.
Displaying the node’s label (tooltip), including locking the label in place.
When you select individual nodes (i.e., select a single node, or use ctrl-click to select multiple individual nodes), the nodes are also pinned.
When you select multiple nodes (by drawing a box around them, or by using any menu-based selection options), the nodes are not pinned.
When you select any nodes (regardless of the method used), the nodes’ labels are displayed but not locked.
See the sections on Pin or Unpin Nodes and Lock or Unlock Labels for additional details.
Select a Single Node
Click on a node to select it.
Selecting a node (or selecting multiple nodes using ctrl-click) will also pin the nodes and display (but not lock) the nodes’ labels. When you select a node, the node and its edges / connections are highlighted with heavy lines (vs. thin lines on hover-over).
Select Multiple Nodes
To select multiple contiguous nodes, shift-click and hold and use your pointing device to draw a box around the nodes:
Locate and Select Specific Nodes
You can search / select nodes based on their form or primary property value.
From the display mode hamburger menu, choose Selection > Select nodes from string:
In the Select nodes from string dialog box, enter the string to search for and click Select:
Synapse will select any matching nodes:
Tip
When searching for and selecting nodes, you can search using:
The full form name (e.g.,
inet:email) to find all nodes of a particular form;A full or partial string matching any portion of a node’s primary property.
When matching the primary property, you can match any part of the value (there is no minimum string length and you are not limited to matching by prefix or token).
You can match any primary property that is a singular value (including guid values from guid-based nodes).
Currently, this feature will not match primary property values from composite (comp) forms (such as inet:dns:a
nodes).
Adjust the Appearance of the Graph
You can make adjustments to the appearance of your graph, including:
Pinning nodes in place;
Locking node labels so they remain visible;
Removing nodes from the graph display.
Pin or Unpin Nodes
Pin a Node
To pin an individual node, select the node:
Tip
Selecting a node will pin the node, but deselecting the node does not automatically unpin it.
Unpin a Node
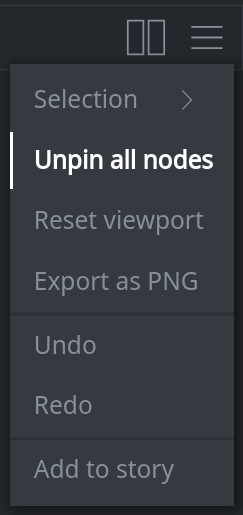
To unpin a node (or a set of selected nodes), right-click the node and choose unpin node from the context menu:
Tip
Unpinning a node does not automatically deselect the node.
You can unpin all nodes by selecting the option from the display mode hamburger menu:
Lock or Unlock Labels
Locking a label ensures that the label will remain visible when you deselect the node / select another node.
Lock a Label
To lock a node’s label (or the labels for a set of selected nodes), right-click the node and choose lock label (or lock labels) from the context menu:
Unlock a Label
To unlock a node’s label (or the labels for a set of selected nodes), right-click the node and choose unlock label (or unlock labels) from the context menu:
The label(s) will be removed the next time you select a node (or deselect any currently selected nodes).
Remove Nodes from the Graph
You can modify the appearance of your graph by removing individual nodes or sets of nodes.
Tip
Removing a node from Force Graph does not delete the node from Synapse; it simply removes the node from your display.
The Force Graph display mode hamburger menu includes both Undo and Redo options that allow you to modify recent actions without having to reset your entire graph (i.e., by re-running your original query):
Remove an Individual Node
To remove a node (or nodes), right-click the node and choose remove node from the context menu:
Remove a Group of Nodes
Select the set of nodes to remove using any of the available multi-select options.
Right-click any selected node and choose remove nodes from the context menu:
Tip
If you want to preserve only a small subset of nodes, you can select the nodes you want to keep and use the Invert Selection option to switch your selection and allow removal of large numbers of nodes.
Explore Using Force Graph
You can explore data in Force Graph mode, similar to the way you Explore Data in Tabular Mode. When you explore in Force Graph, Synapse adds any nodes that are “connected” (by shared properties or light edges) to the node(s) you explore from, based on the graph projection rules in use.
Tip
Exploring from a “highly connected” may cause Force Graph to add a large amount of data to your Results Panel. You can limit the number of results that Force Graph will load before pausing or stopping.
The Force Graph display mode hamburger menu includes both Undo and Redo options that allow you to modify recent actions without having to reset your entire graph (i.e., by re-running your original query).
Explore from a Node
To explore from a node, right-click the node and choose explore node from the context menu:
Tip
You can also double-click any node to explore from that node.
Explore from Multiple Nodes
To explore from multiple nodes, use any of the methods to multi-select nodes.
Right-click any selected node and choose explore node from the context menu:
Custom Graph Projections
In order to visualize data in Force Graph mode, Synapse’s hypergraph data needs to be transformed into a directed graph-style display. A graph projection - a set of pivots, filters, and other configuration settings - defines the data to be included and is used to generate the force graph.
Force Graph mode includes one default projection. The default projection is generic and is useful for getting an overview of the general “connectedness” of any result set. However, the default projection may be less useful if you want to visualize a specific subset of data and relationships. You can Adjust the Appearance of the Graph to remove unwanted nodes or connections, but those manual options are best suited for fine-tuning - not displaying a particular subset of data to support a specific analysis task.
Instead, you can define a custom graph projection to display only those nodes and relationships you want to see. The projection can be saved, edited, and shared with others in your organization.
Note
Optic’s Force Graph display mode is a visual extension of the built-in Synapse graph command. The
tabs and features available in Optic to create a custom projection generally correspond to the options
available for that command. Where applicable, we note the equivalent graph command option in the
descriptions below.
Select a Graph Projection
Use the Graph Projection dropdown menu to select the projection to use:
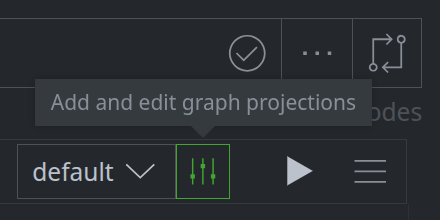
Create a New Graph Projection
Click the configure icon next to the Graph Projection dropdown menu to open the Edit Custom Graph Projections dialog:
You can copy an existing projection and modify it, or create a new (empty) projection.
To copy a projection, click the hamburger menu next to the projection and select copy:
To create a new projection, click the hamburger menu next to the search bar and select Add New:
Projection Options
This section describes the tabs and available options within the Edit Custom Graph Projections dialog. The same options apply whether you are creating a new graph projection or modifying an existing projection (or a copy of a projection).
The PIVOTS/FILTERS tab is used to specify the specific forms, relationships, and results that you want to display in your graph.
The OPTIONS tab is used to configure additional parameters used to generate the graph.
The PERMS tab is used to allow others to use (read) or edit a custom graph projection, or to deny access to the projection.
Tip
This section describes creating and using custom graph projections from a user perspective. For simplicity we may omit or limit discussion of some technical details related to graph operations.
Save and Rollback
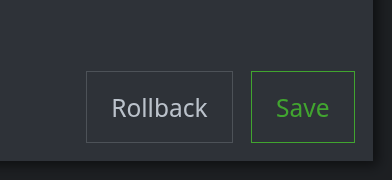
The Save and Rollback buttons (available on all tabs in the Edit Custom Graph Projections dialog) will preserve or discard all current changes to your projection, respectively. The buttons are grayed out until you make any changes.
Click the Save button to save your changes at any time and preserve your work in progress:
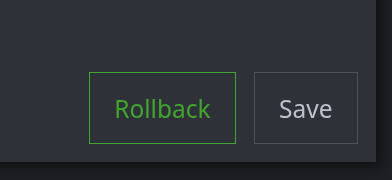
Click the Rollback button to discard all changes made since your last Save:
Note
Both buttons apply to all tabs. For example, you do not need to click the Save button to preserve work on one tab before changing to another tab (though it is a good idea to periodically save your work). Similarly, clicking the Rollback button will discard ALL unsaved changes on ANY tab.
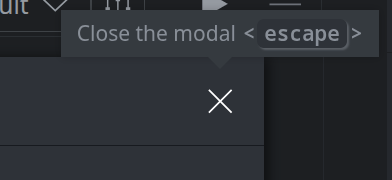
When you are finished, click the X in the upper right of the dialog (or press the escape key) to exit the dialog:
Note
Exiting the dialog will discard all unsaved changes.
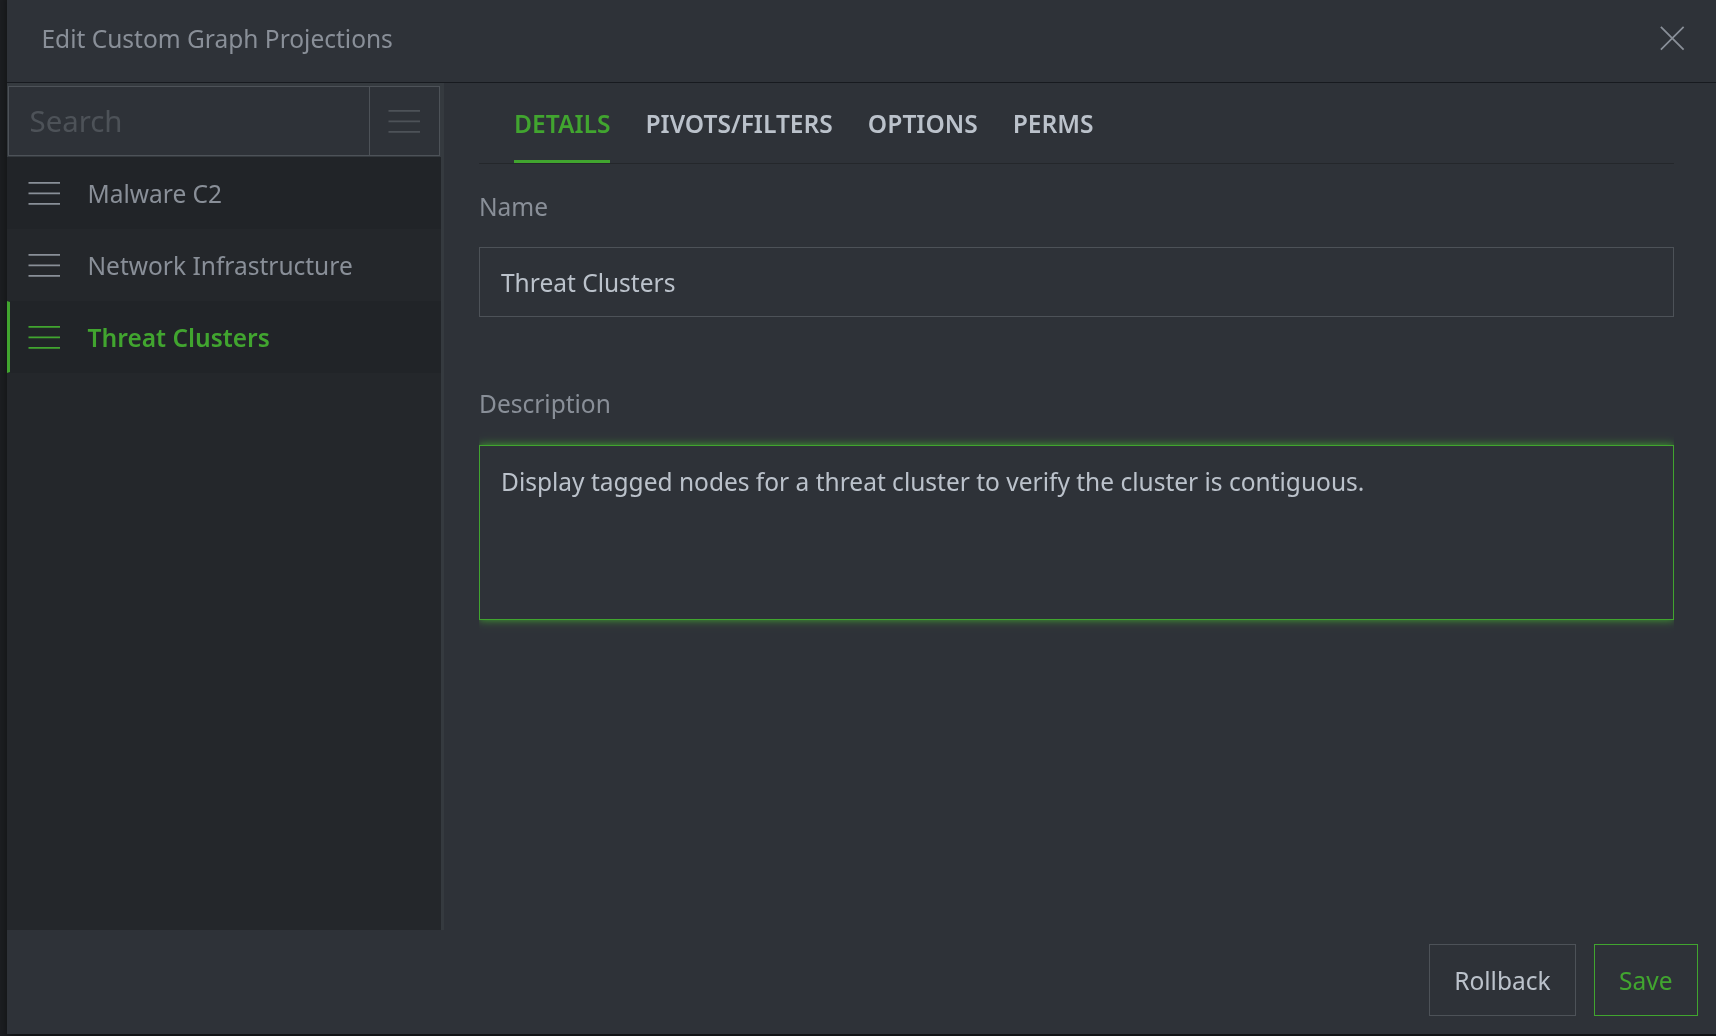
DETAILS Tab
Use the DETAILS tab to specify a name and optional description for the graph projection:
PIVOTS/FILTERS Tab
Use the PIVOTS/FILTERS tab to specify the nodes and relationships to include in your graph projection. Pivots and filters are specified using Storm.
To add, edit, or remove a pivot or filter:
Click the + Add button to add a pivot or filter.
Edit any pivot or filter to modify it.
Click the red trash can icon to delete a pivot or filter.
Use the Save and Rollback options to save (or discard) your changes.
PIVOTS
Pivots define the navigation that should be performed to generate the graph projection.
“Pivot” in this context is used broadly - it refers to any Storm expression that is used to traverse Synapse’s hypergraph from a set of source nodes to a set of target nodes. The Storm expression will generally include at least one pivot operation (that is, a pivot, edge traversal, or join). But the expression can use other Storm operations (such as filters) or Storm commands as part of the overall navigation.
Global Pivots are applied to all nodes. A global pivot must be generic enough to apply to all nodes/forms, so is useful for wildcard-style pivots (e.g.,
-> *) or traversing commonly used edges (e.g.,<(seen)- meta:source). A Global Pivot is equivalent to the--pivotoption of the Stormgraphcommand.Form Specific Pivots are applied to the specified form only. These can be used to perform specific navigation to display selected relationships. A Form Specific Pivot is equivalent to the
--form-pivotoption of the Stormgraphcommand.
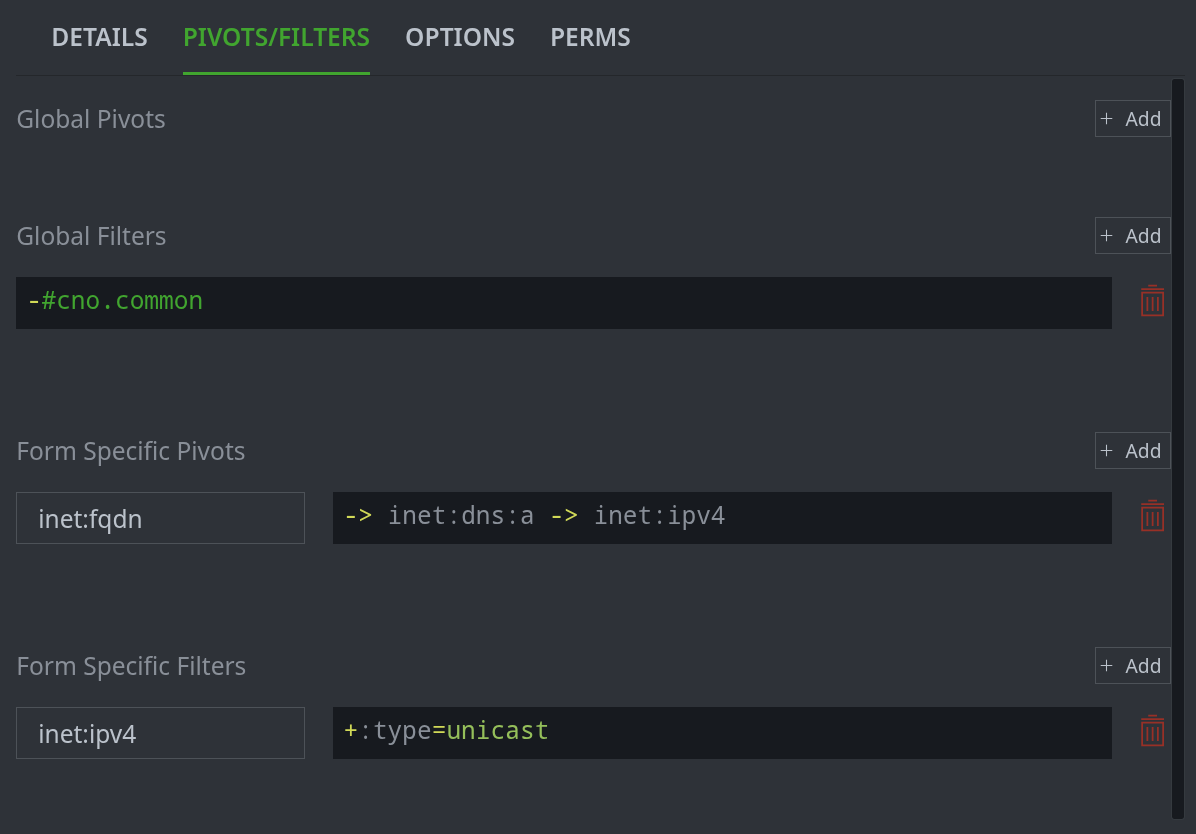
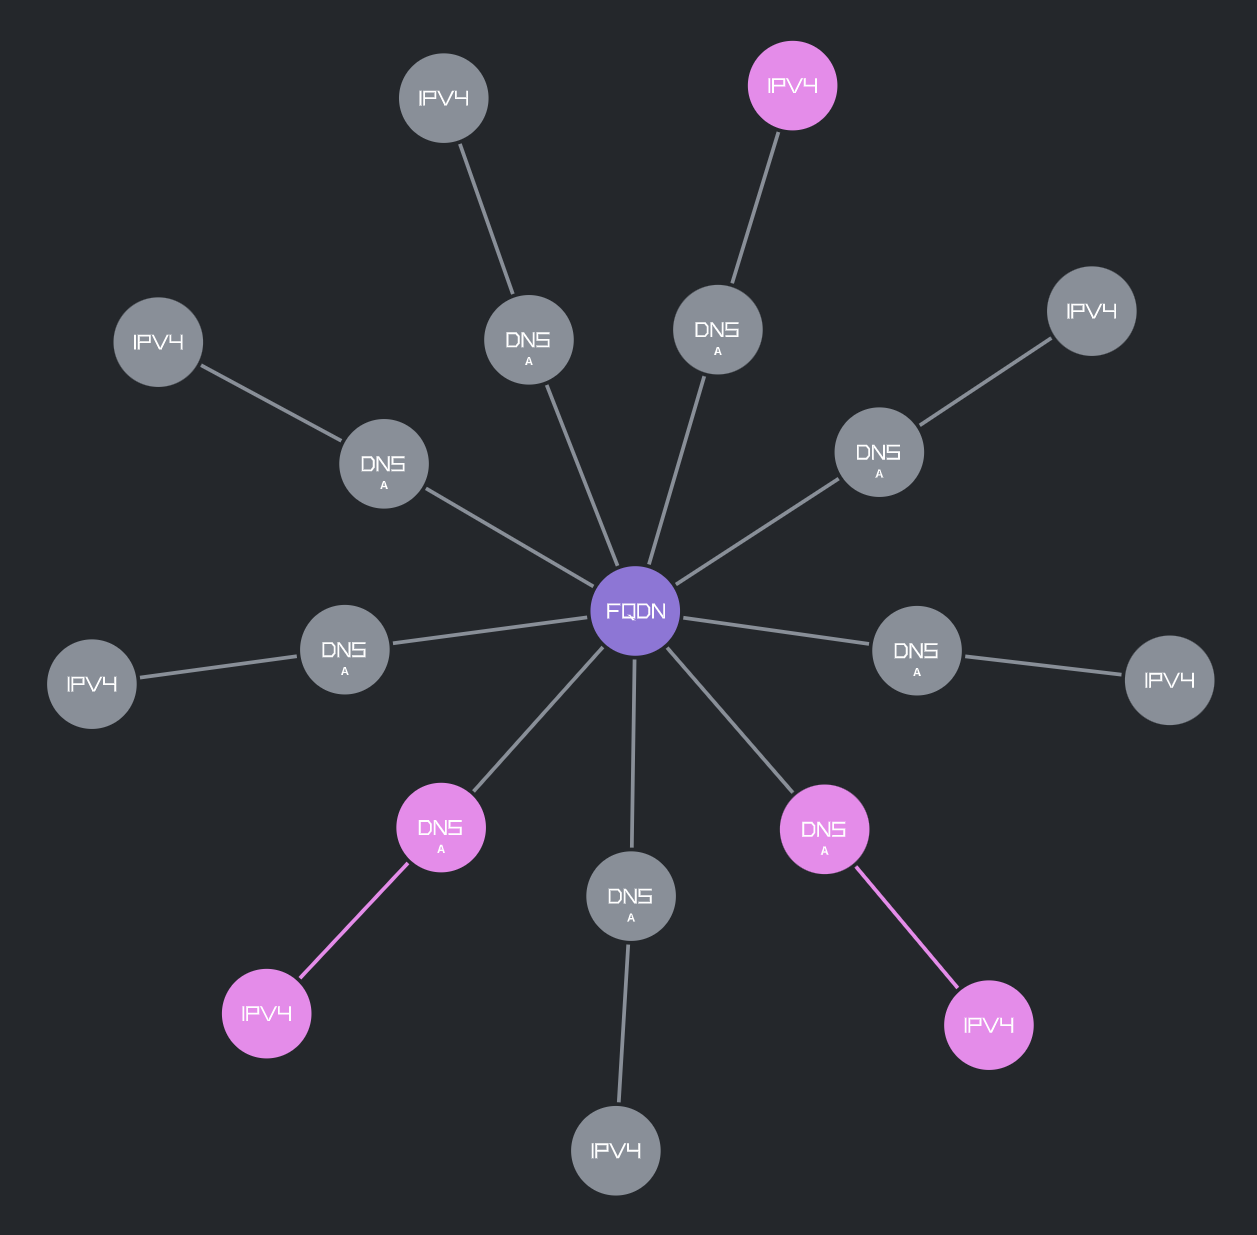
Both global and form-specific pivots will display and link the first (source) and last (target) nodes defined by the pivot’s Storm expression. You can define pivots to display nodes in the force graph that are directly adjacent to each other in Synapse, or nodes that are separated by one or more intervening connections. For example:
The two pivots above will display the inet:fqdn node(s), their connected inet:dns:a node(s), and the
connected inet:ipv4 node(s). Each edge represents a specific connection between the linked nodes (in this
example, shared property values). With respect to the graph projection, the inet:ipv4 nodes are two
degrees away from the inet:fqdn node:
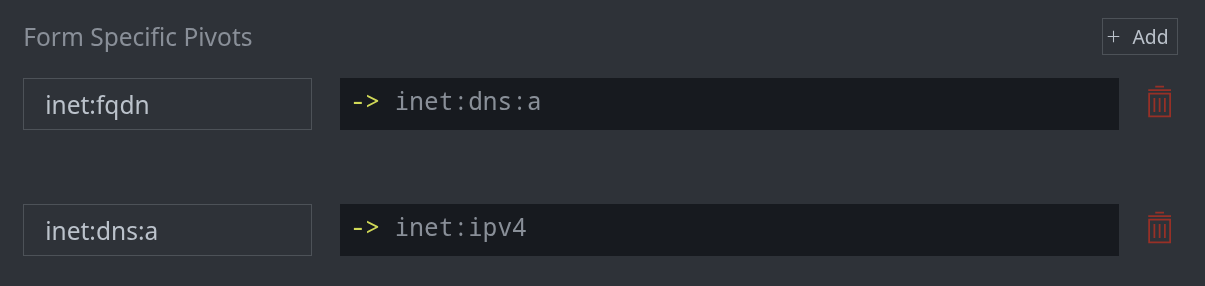
Pivots can also be used to navigate between non-adjacent source and target nodes. This will omit the intervening nodes from the graph projection. For example:
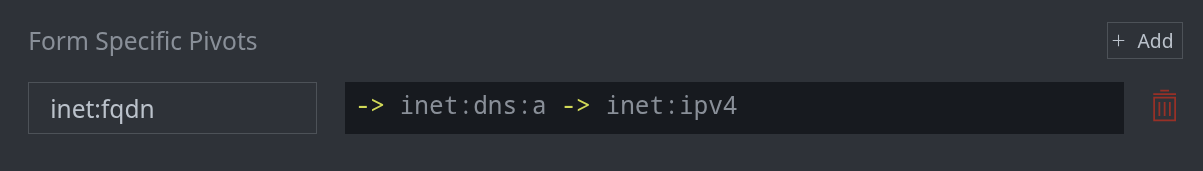
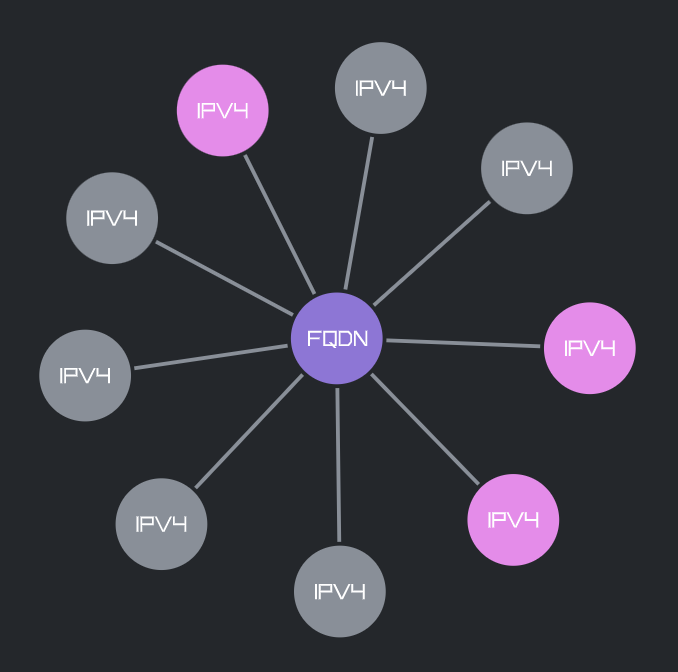
The pivot above will display the inet:fqdn node(s), navigate through the inet:dns:a node(s) to the inet:ipv4
node(s), and link the FQDNs directly to the IPv4s. The edge represents the full navigation (as defined by the
pivot expression) to get from the source to the target. With respect to the graph projection, the inet:ipv4
nodes are one degree away from the inet:fqdn:
Tip
You can specify the total number of degrees (connections from your source or seed nodes) to display in your force graph projection on the OPTIONS tab.
FILTERS
Filters define nodes that should be included in (or excluded from) the graph projection.
Just as with pivots, “filters” is used broadly with respect to the projection. The Storm expression used to define a graph projection filter will typically include at least one Storm filter operation, but a projection filter can include additional Storm.
Global Filters are applied to all nodes. They are equivalent to the
--filteroption of the Stormgraphcommand.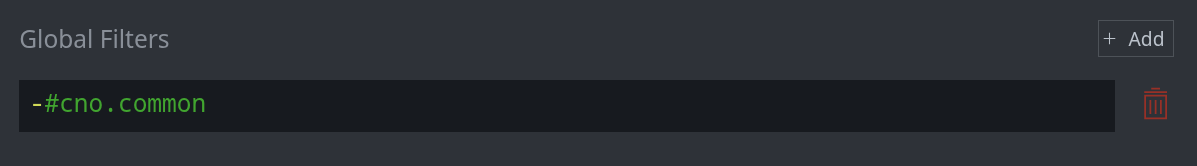
Form Specific Filters are applied to the specified form only. They are equivalent to the
--form-filteroption to the Stormgraphcommand.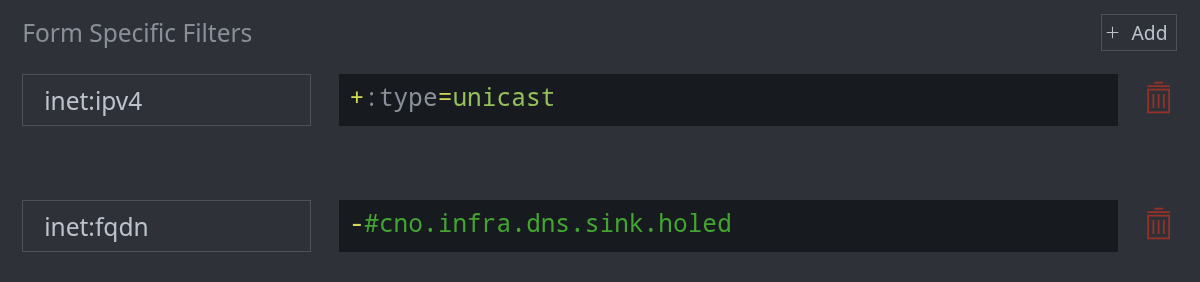
OPTIONS Tab
Use the OPTIONS tab to configure additional parameters for the graph projection. Each option is described in detail below.
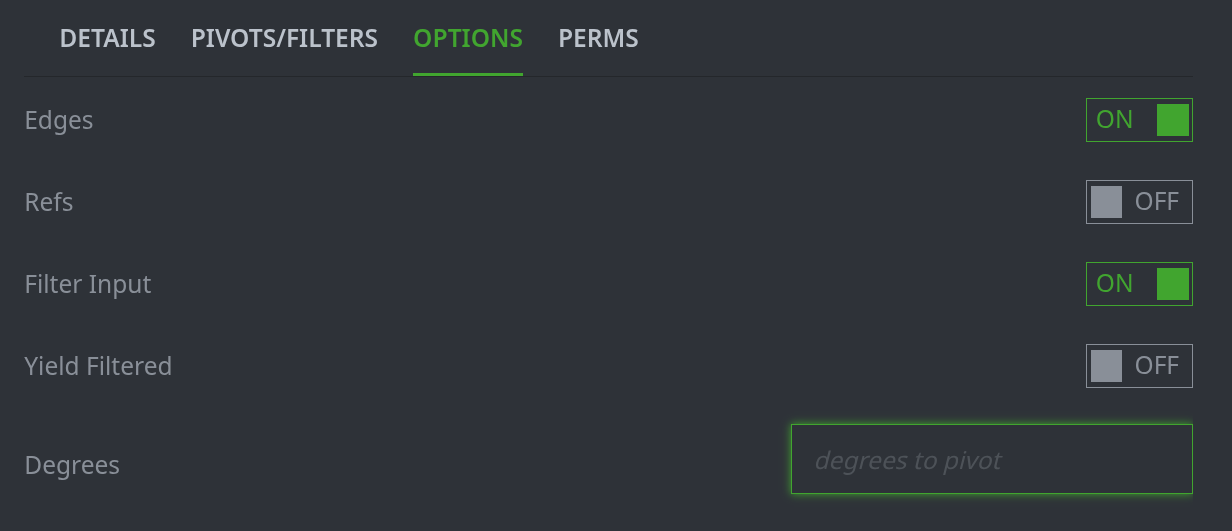
Edges: Default: ON.
When ON, this option checks for any light edge connections to or from nodes in the graph. Any light edges are added as links in your graph projection.
When OFF, these edges are not displayed. The OFF option is equivalent to the
--no-edgesoption in the Stormgraphcommand.Tip
You can include specific edge relationships in your graph projection by defining them as pivots on the PIVOTS/FILTERS tab.
Refs: Default: OFF.
When ON, this option will perform a global “refs out” pivot (i.e., a wildcard pivot out or
-> *) from nodes in the graph. It effectively adds-> *as a global pivot, without needing to add it on the PIVOTS/FILTERS tab. (Technically, the option uses getNodeRefs() on the nodes.) The ON option is equivalent to the--refsoption in the Stormgraphcommand.Filter Input: Default: ON.
When ON, any filters defined on the PIVOTS/FILTERS tab will apply to all nodes, including your seed nodes. (Your seed nodes are the initial nodes input into your graph projection. In Optic, they are typically the nodes that result from the Storm query you run in Force Graph mode. Any nodes that you subsequently add to the Force Graph display - such as by “exploring” from an existing node - are also considered seed nodes.)
When OFF, all of your seed nodes will be included in the graph, regardless of any global or form specific filters defined on the PIVOTS/FILTERS tab. The OFF option is equivalent to the
--no-filter-inputoption in the Stormgraphcommand.)Yield Filtered: Default: OFF.
When ON, nodes that would otherwise be dropped by a filter will be included in the graph, but Synapse will not perform any additional pivots that would normally apply to that node. The ON option is equivalent to the
--yield-filteredoption in the Stormgraphcommand.Degrees: Default: 1 (i.e., if you do not specify a value here, Optic will default to 1 degree).
Specifies the number of degrees out (graph connections) from your seed nodes to generate and display when creating the graph projection. Each line (graph edge) connecting two nodes represents one degree, regardless of the navigation used to create the connection.
This option is equivalent to the
--degreesoption of the Stormgraphcommand.
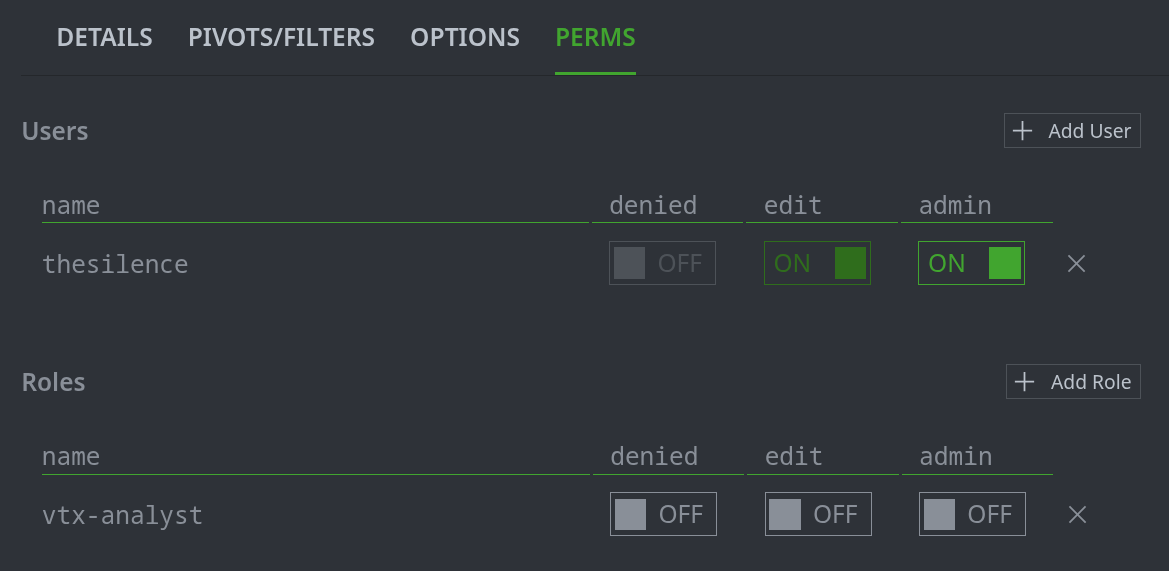
PERMISSIONS Tab
Use the PERMISSIONS tab to share a graph projection with other users or roles.
See the Grant Permissions section of the Optic User Guide for an overview of this process.
Graph Generation
Your force graph is generated from your seed (starting) nodes using your graph projection. When using Force Graph mode in Optic, your seed nodes are the nodes you add to the Force Graph display - typically the nodes returned by the Storm query you run in the query bar. However, nodes that you subsequently add to your existing Force Graph display are also considered seed nodes (for example, when you use the right-click explore node menu option to explore from an existing node).
In general, given the combination of pivots, filters, and options defined in your graph projection, your force graph should be generated and displayed as expected. However, there is a certain amount of complexity required to generate a two-dimensional, “flattened” graph projection from Synapse’s multi-dimensional hypergraph data store.
To assist in any troubleshooting, we provide the following simplified overview of how the force graph projection is generated:
Start with the set of seed nodes. These are the nodes to be processed by the graph projection; you can think of these nodes as a “to do” list.
Each seed node is processed individually according to the parameters (filters, pivots, and options) of the graph projection.
The graph projection parameters are applied in the following order:
Global filters (including any filter settings from the OPTIONS tab). If multiple global filters are specified, they are applied in the order in which they are listed.
Form specific filters (in the order listed).
The “Refs” parameter from the OPTIONS tab, if enabled.
Global pivots (in order).
Form specific pivots (in order).
The “Edges” parameter from the OPTIONS tab, if enabled.
Each node that results from applying the various projection parameters is added to the “to do” list for processing. The node will not be added to the “to do” list if:
The node was already processed (i.e., avoid looping over the same nodes).
The node is too far away from a seed node (based on the Degrees specified on the OPTIONS tab).
Continue until there are no nodes left to process (no nodes in the “to do” list).