Stories Tool
The Stories Tool can be accessed from the Optic Toolbar:
Use the Stories Tool to create, edit, collaborate on, and publish reports directly from Synapse.
With the Stories Tool, you can:
Add and configure common report elements such as title blocks, prose, and images.
Embed Synapse data directly in your report using any of the Research Tool’s display modes (tabular, force graph, statistics, or geospatial).
Automatically refresh and update data in your report if the data in Synapse changes.
Collaborate with other users on a report.
Create, reply, and resolve comments directly within a report as part of your review process.
Create templates to automatically generate common reports.
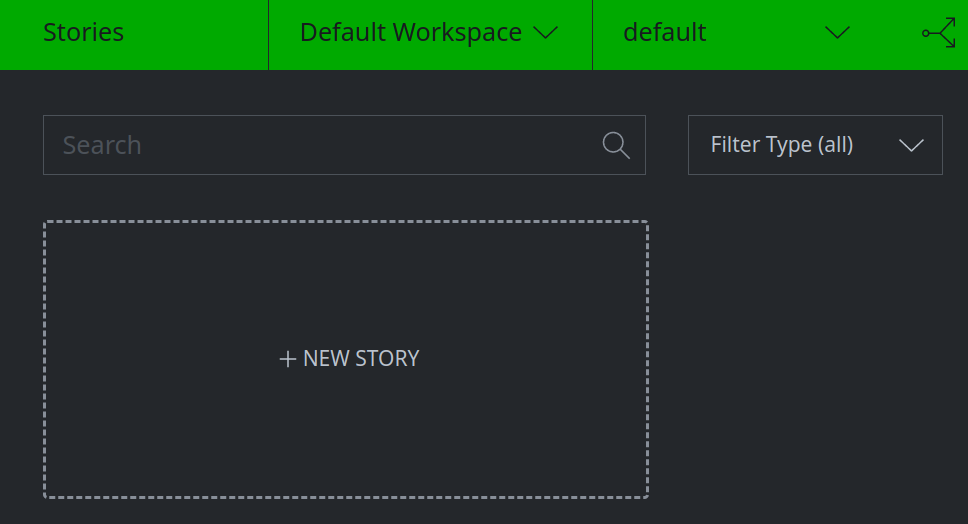
Create a New Story
In the Stories Tool, click the + NEW STORY card to create a new Story:
In the New Story dialog, provide a title and description for your Story. Click + CREATE to create the new Story.
Copy an Existing Story
In the Stories Tool, locate the Story you want to copy. Click the copy icon to create a copy of the Story:
Open a Story
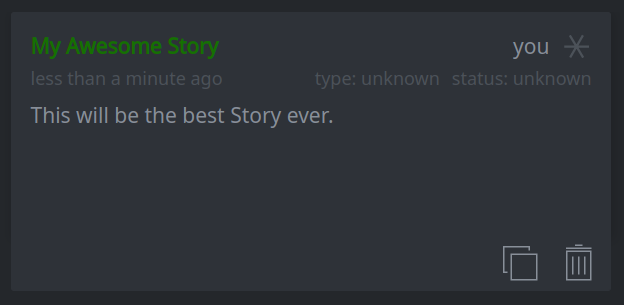
In the Stories Tool, click on a Story card to open it:
Set or Update a Story’s Type
Tip
Story Types are user-specified categories that can help organize your Stories. In the main Stories Tool, you can filter visible Story cards by Type (among other properties) to more easily locate and view existing Stories.
Open the Story whose type you want to set (or update). (See Open a Story.)
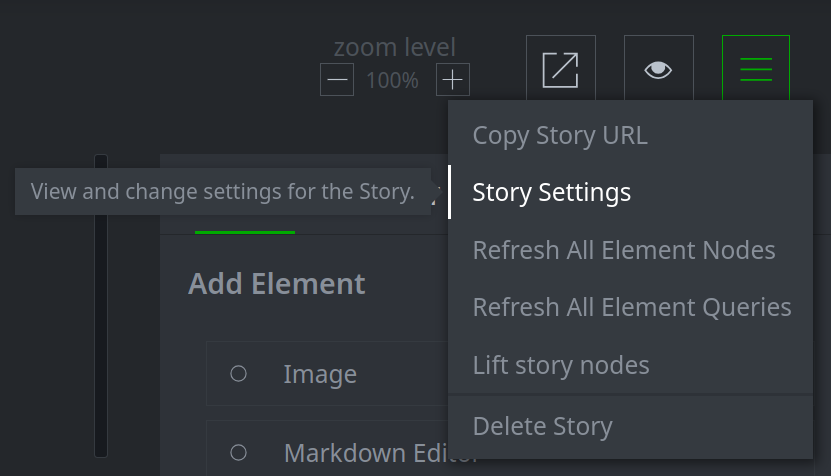
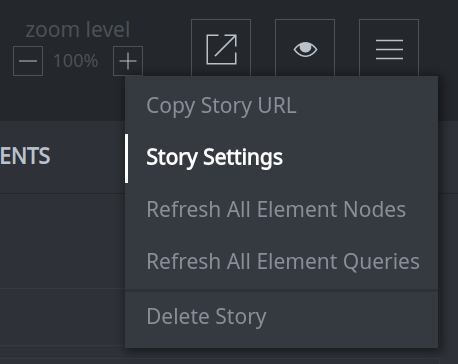
From the main Stories hamburger menu, select Story Settings:
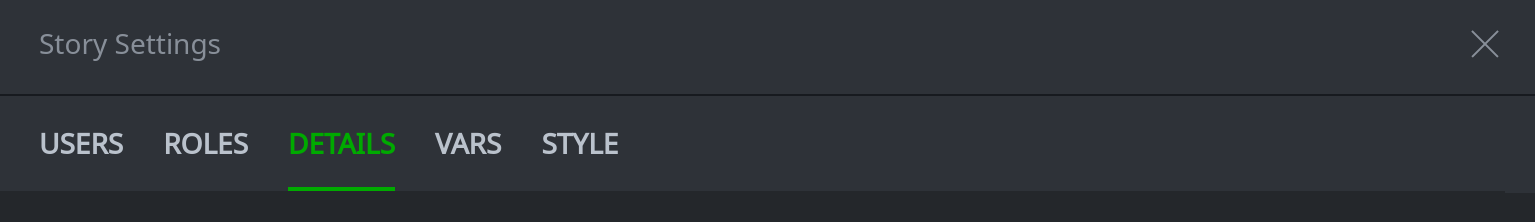
In the Story Settings dialog, select the DETAILS tab:

In the type field, enter the type to use for this Story (or select an existing type from the drop down list:
A green check mark will appear in the type field to indicate that the type has been set / saved.
Click the X in the upper right corner to exit the Story Settings dialog.
Set or Update a Story’s Status
Tip
Story Statuses are user-specified categories that can help organize your Stories. In the main Stories Tool, you can filter visible Story cards by Status (among other properties) to more easily locate and view existing Stories.
Open the Story whose status you want to set (or update). (See Open a Story.)
From the main Stories hamburger menu, select Story Settings:
In the Story Settings dialog, select the DETAILS tab:
In the status field, enter the status to use for this Story (or select an existing status from the drop down list:
A green check mark will appear in the status field to indicate that the status has been set / saved.
Click the X in the upper right corner to exit the Story Settings dialog.
Customize a Story’s Appearance
You can customize the colors and fonts in an individual Story to change its appearance or to match your organization’s branding. These features are modified through a Story’s Story Settings menu.
Tip
To use custom settings for all Stories, create a new “empty” Story that just contains your custom settings. You can then copy this Story to use these settings as the basis for any new Stories. You can give others access to your customized layout so they can use it too. (Consider giving others only read access to prevent accidental modifications to the layout).
To modify a Story’s appearance:
Create, copy, or open the Story whose appearance you want to modify.
From the Story’s main hamburger menu, select Story Settings:
In the Story Settings dialog, select the STYLE tab:
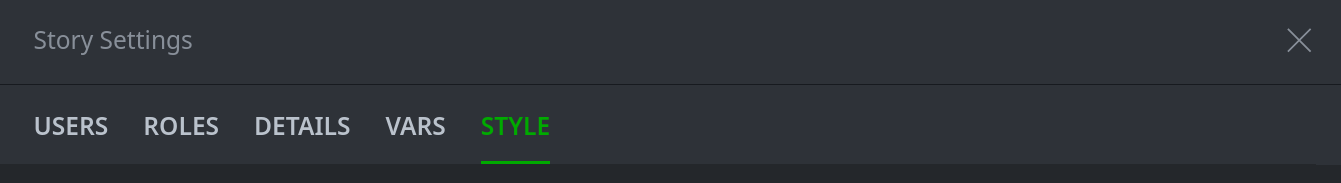
Follow the instructions below to customize particular features and to save any changes.
Customize a Story’s Colors
In the Story Settings dialog, on the STYLE tab, locate the Colors section:
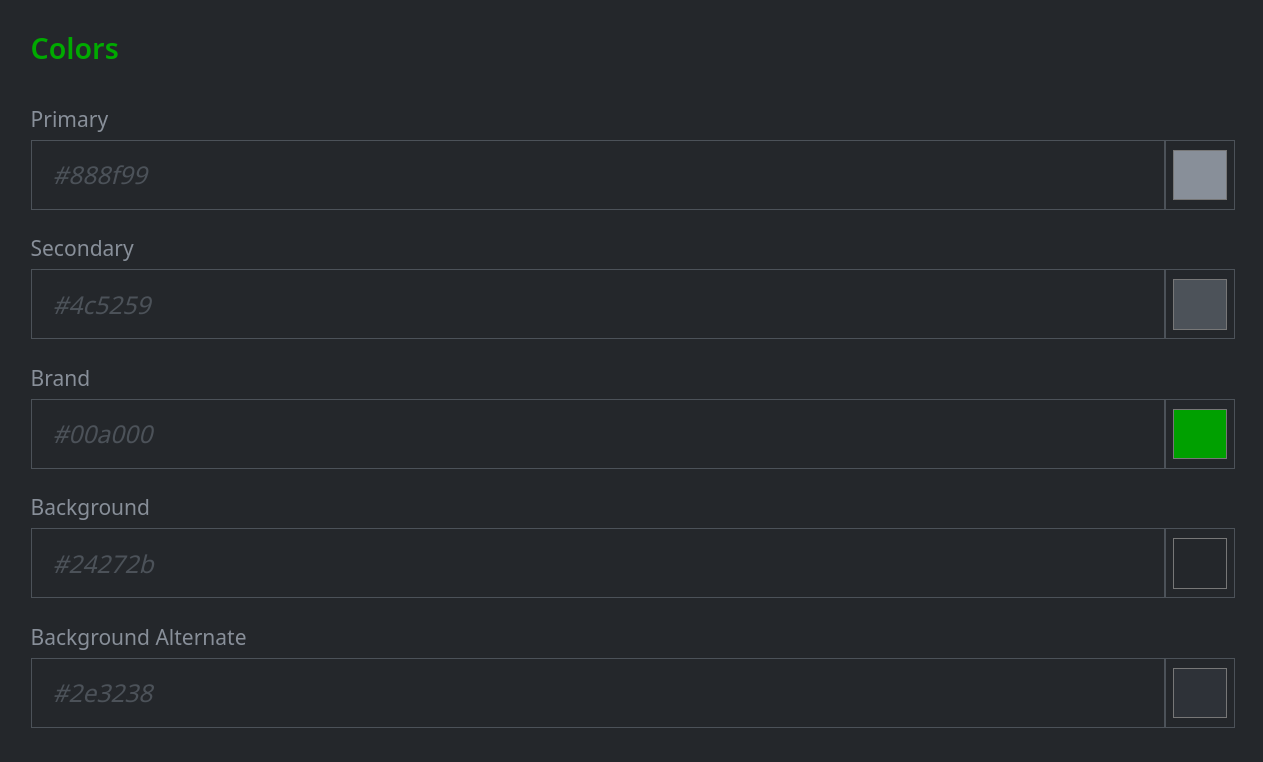
Use the fields to change the color values for the features you want to modify:
Tip
You can enter the colors (as hex values) directly in the field, or click the colored square to manually select a color, or enter the value in RGB, HSL, or hex.
As you enter your selections, the Story content will change to allow you to preview the new settings.
Customize a Story’s Fonts
Note
To specify a font in a Story, the font must be:
installed in your operating system, and
recognized by your browser.
If a font is not available or not displaying as expected, please ensure that it is installed and
recognized correctly. Depending on your operating system and/or browser, you may need to explicitly
update your fonts/font cache (for example, using fc-cache -f on Linux) and/or restart all instances
of your browser for newly installed fonts to be recognized. See your operating system and browser
documentation for details.
In the Story Settings dialog, on the STYLE tab, locate the Fonts section:
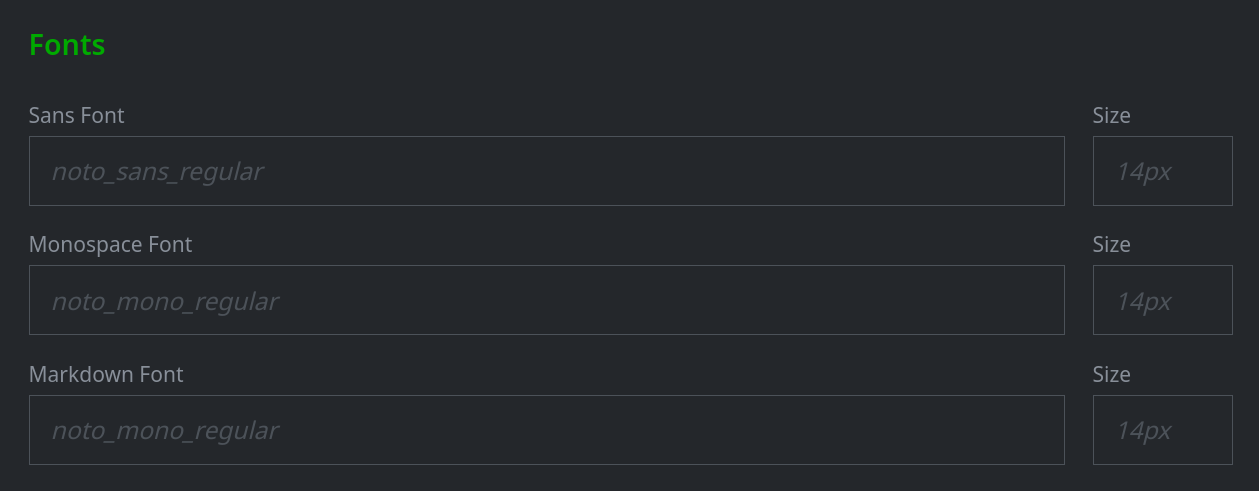
Use the fields to specify the font you want to use for each kind of text. You can also specify the size for a given font (in ems or pixels (px)):
Tip
Enter the font name as it appears on your system (i.e., as displayed in your font manager), including any spaces in the name (such as “liberation sans”). For Optic, font names are not case-sensitive. Note that you do not need to use underscores (as shown in the “example” text in the font fields) unless they are explicitly part of the font name.
Sans Font is used for Story element headers / titles.
Monospace Font is used for data elements such as node tables. You do not have to specify a monospace font for this option, but we recommend one for the best display of these elements.
Markdown Font is used for text in Markdown elements.
If you use custom fonts, users will need to have the same font(s) installed in order to view the Story in the same way. If a user does not have the font installed, the Story may revert to the user’s default fonts, or may not display correctly.
Customize a Story’s Markdown Headers
You can change the size of the Markdown headers by specifying a different height for each header style.
In the Story Settings dialog, on the STYLE tab, locate the Markdown section:
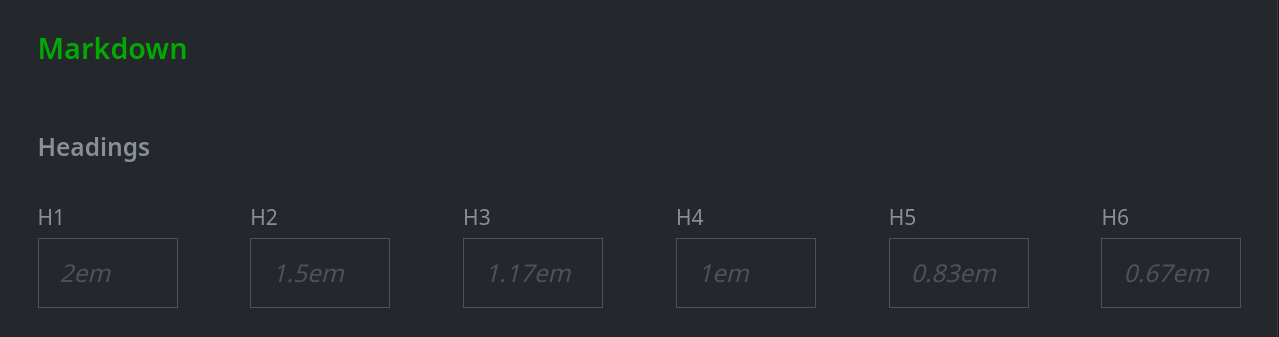
In the header fields, specify the new size for the header (in ems or pixels (px)):
As you enter your selections, the Story content wlil change to allow you to preview the new settings.
Save Your Changes
When you are finished:
select Save to save your changes.
select Rollback to return to the previous settings..
select Reset to Default to return to Optic’s original settings.
After you make your selection, click the X in the upper right corner to exit the dialog.
Add a Basic Element
From the Stories Details Panel, on the PALETTE tab, click the element you want to add:
Your element will be added to the Clipboard area of the PALETTE tab.
Tip
If you are adding an image, specify either:
the file to upload, or
the URL to download the file.
Click the Submit button to add the image:
Add Data from Synapse
Note
When adding data to your Story from Synapse, you have two options:
Write a Storm query that generates the data you want; or
Use UI features (such as the Query Bar Lookup mode or the Explore button) to navigate to the data you need.
Using a Storm query gives you the greatest flexibility to review and revise your Story. With Storm, you can refresh either the nodes or the entire query within your Story at any time. Anyone reviewing your Story can see the exact Storm query that generated your data.
Using Synapse’s UI features will add the data “as is”, but in most cases you will be unable to refresh the data. Anyone reviewing your Story will see your original query (your “starting point”) but the navigation you performed to reach your data is not preserved with your Story element.
Add a Node
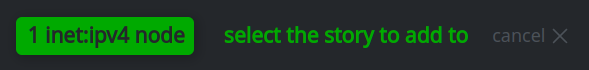
In the Research Tool, identify the individual node that you want to add to your Story. Right-click the node and select add node to story from the context menu.
Tip
You can select a node from any of these display modes: Tabular, Force Graph, or Geospatial.
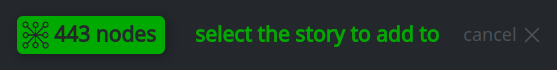
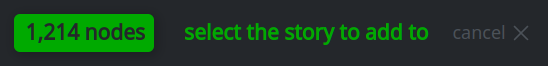
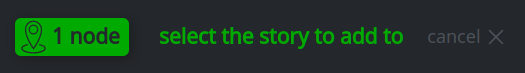
The node will be added to the Clipboard of the currently open Story. If no Story is open, Synapse will prompt you to select one:
You can configure the appearance of the node (e.g., select which properties are displayed, and in what order) from the Stories Tool.
Add a Table
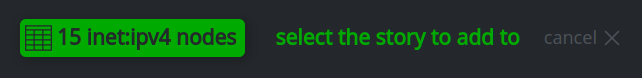
In the Research Tool, Tabular display mode, identify the table that you want to add to your Story. From the table’s hamburger menu, select Add to story:
The table will be added to the Clipboard of the currently open Story. If no Story is open, Synapse will prompt you to select one:
You can configure the appearance of the table (e.g., select which columns are displayed, and in what order) from the Stories Tool.
Add a Force Graph
In the Research Tool, Force Graph display mode, generate the force graph that you want to include in your Story:
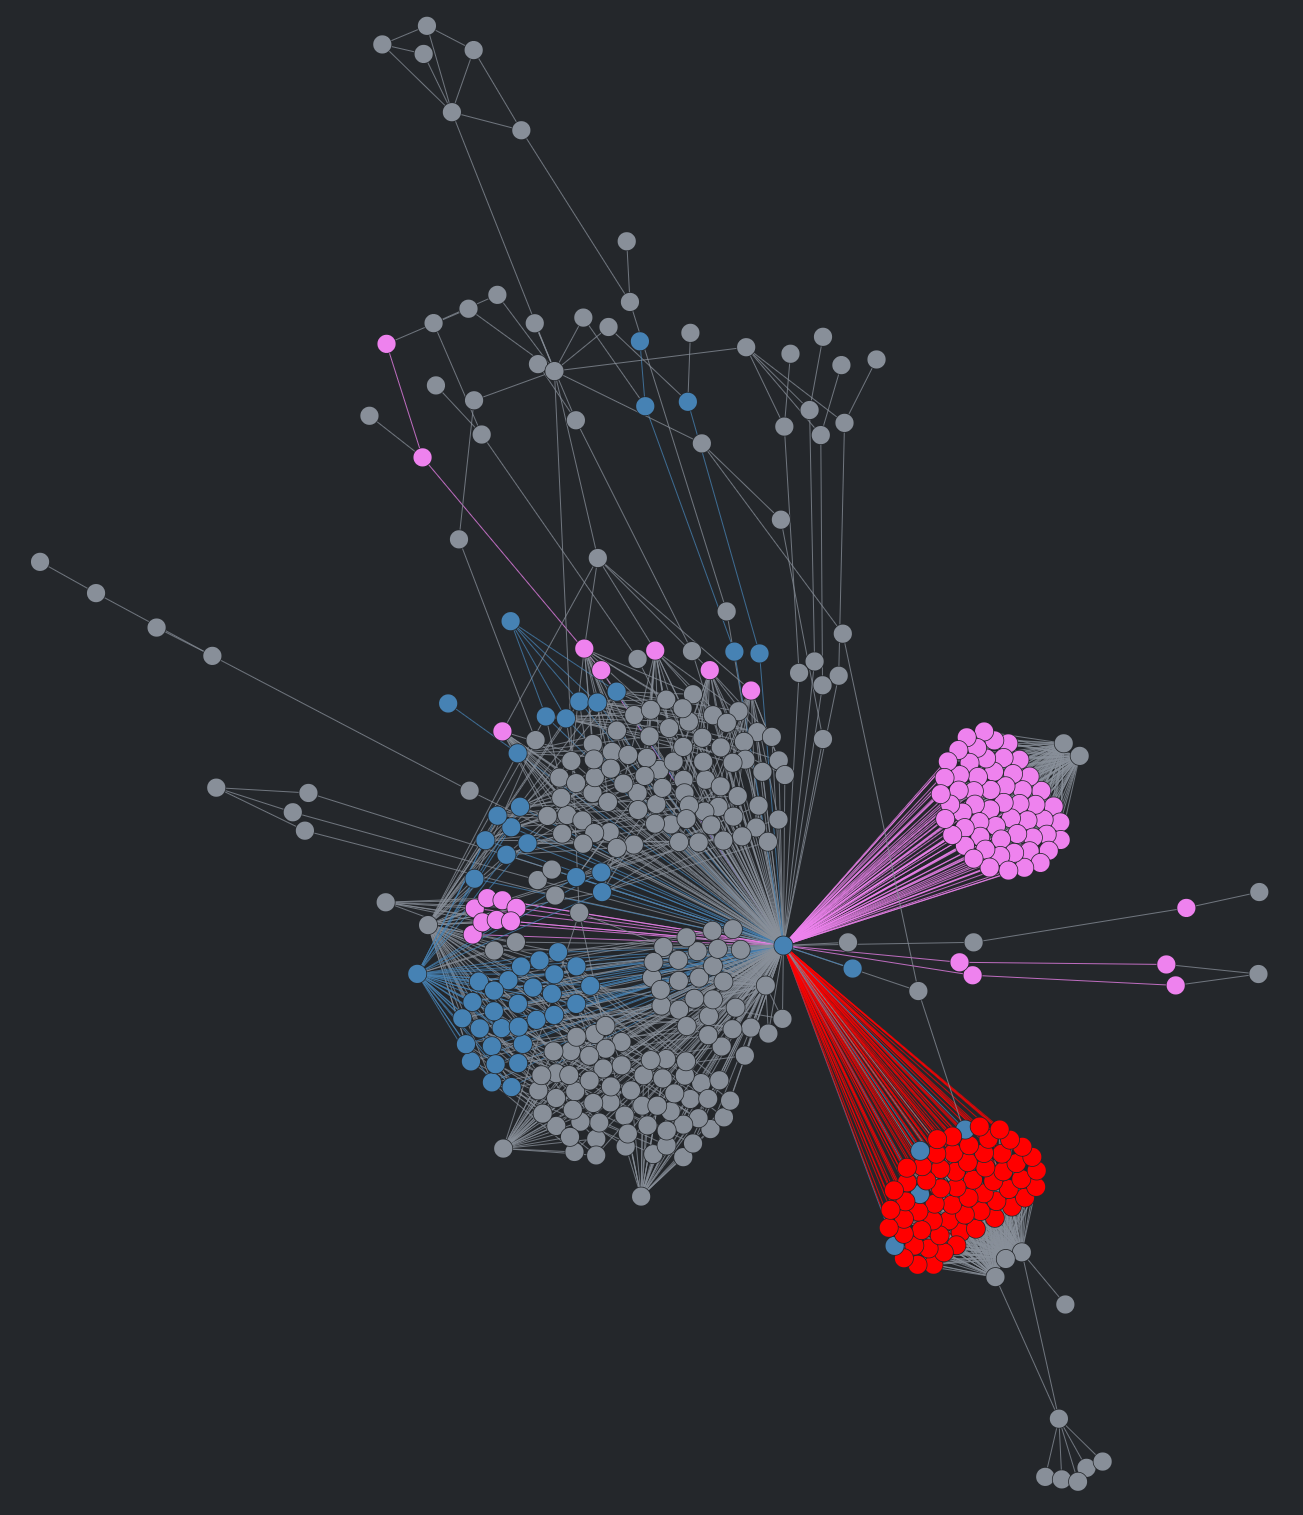
From the Force Graph hamburger menu, select Add to story:
The force graph will be added to the Clipboard of the currently open Story. If no Story is open, Synapse will prompt you to select one:
Add a Statistics Chart or Graph
In the Research Tool, Statistics display mode, generate the chart(s) that you want to include in your Story. From the hamburger menu of the chart or graph that you want to include, select Add to story:
The chart or graph will be added to the Clipboard of the currently open Story. If no Story is open, Synapse will prompt you to select one:
Add a Map Image
In the Research Tool, Geospatial display mode, generate the map image that you want to include in your Story. From the display mode hamburger menu, select Add to story:
The map image will be added to the Clipboard of the currently open Story. If no Story is open, Synapse will prompt you to select one:
Add an Element to Your Story from the Clipboard
In the Stories Details Panel, select the PALETTE tab. From the Clipboard, click and hold the element you want to add to your Story. Drag the element from the Clipboard to your Story body:

Move or resize the element as needed.
Edit a Data Element
To edit a data element, it must be in your Story body (see Add an Element to Your Story from the Clipboard).
Locate the element and click the edit icon to open it for editing.
The element will be opened in the Details Panel, ELEMENT tab.
To edit the element title, make your changes in the title field. Clicking anywhere outside the title field will save your changes:
Tip
You can also edit the title by double clicking it on the element itself.
To edit the Storm query associated with the element, click the Edit Query button to open a Storm editor window.
In the Edit Query window, modify your query as needed. Click the Save button to save your changes and close the window.
When you are finished editing the element, click the edit icon to stop editing.
Tip
For node or table elements, you can edit their layout in the ELEMENT tab (select or deselect columns for display, reorder columns, etc.)
For force graph elements, you can adjust the appearance of the element (focus, zoom, etc.) from within the element when it is selected for editing.
For chart and graph elements, you can modify the chart (e.g., specify the property used to generate a bar graph) from within the element when it is selected for editing.
For map image elements, you can adjust the appearance of the element (focus, zoom, background, etc.) from within the element when it is selected for editing.
Send an Element to the Clipboard
In your Story body, locate the element to send to the Clipboard. From the element’s hamburger menu, select Send to Clipboard.
Give Others Access to Your Story
When you create a Story, you are the owner / admin of the Story. Modify the Story’s permissions to give others access.
Open your Story. From the main Stories hamburger menu, select Story Settings:
From the Story Settings dialog, select either the USERS or ROLES tab, depending on the access you want to grant. Click the + Add Permission button to set a new permission.
Use the drop down list to select the role (or user) to grant access.
Use the perm drop down list to select the level of access.
Add other permissions if needed. When you are finished, click the X to close the Story Settings dialog.
Create a Story Template
A Story template is a Story that uses one or more variables to generate the Story content. The template allows you to easily create custom content on demand, using the latest data in Synapse, by replacing the variables with specific values. Templates are ideal for common reports that you produce on a regular basis.
While the template is standardized, because the report is made up of multiple Story elements, you can still customize your final product by adding, removing, or rearranging elements as needed.
Note
Before you create your Story template:
Decide on the content you want to include in your report. In particular, identify the Storm queries you will run to generate your data.
For those Storm queries, identify one or more variables that will be used to generate similar content, based on the variable as input.
For example, a threat group report could be based around a specific tag (e.g.,
#cno.threat.mythreat) or a node or property value (e.g.,risk:threat:org:name='my threat') used as the basis for your queries.
Create the Template and Add Basic Elements
Open your new Story.
Add basic elements to your story such as a Title/Description, Markdown, etc. as needed (see Add a Basic Element).
Add Synapse Data Using Storm
For each data element that you want to include in your Story, use the Research Tool to Add Data from Synapse.
Note
For a template, you must generate the template elements using Storm. Your queries should be based on the variables you defined above, but should use a specific value to generate the intital set of template data (i.e., as if you were creating a normal Story).
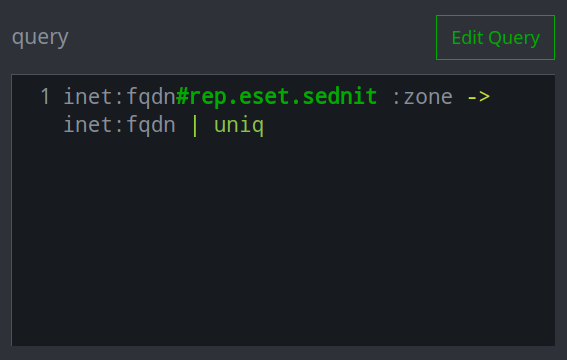
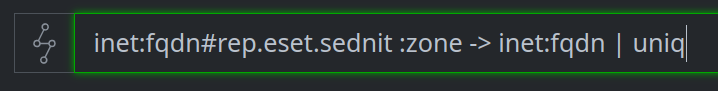
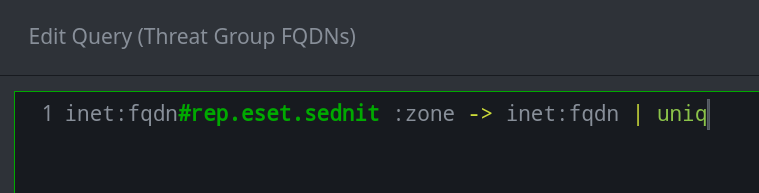
In the example below, we are using ESET’s Sednit threat group (represented by the tag rep.eset.sednit) to obtain all of the DNS zones assocaited with Sednit’s FQDNs:
Create Your Variables
Open your Story template. From the main Stories hamburger menu, select Story Settings:

In the Story Settings dialog, select the VARS tab. In the Edit vars as YAML window, list the name(s) of your variable(s). Each name should be followed by a colon (
:). (When you use the template to generate a report, you will specify the value to use for the variable(s) here.)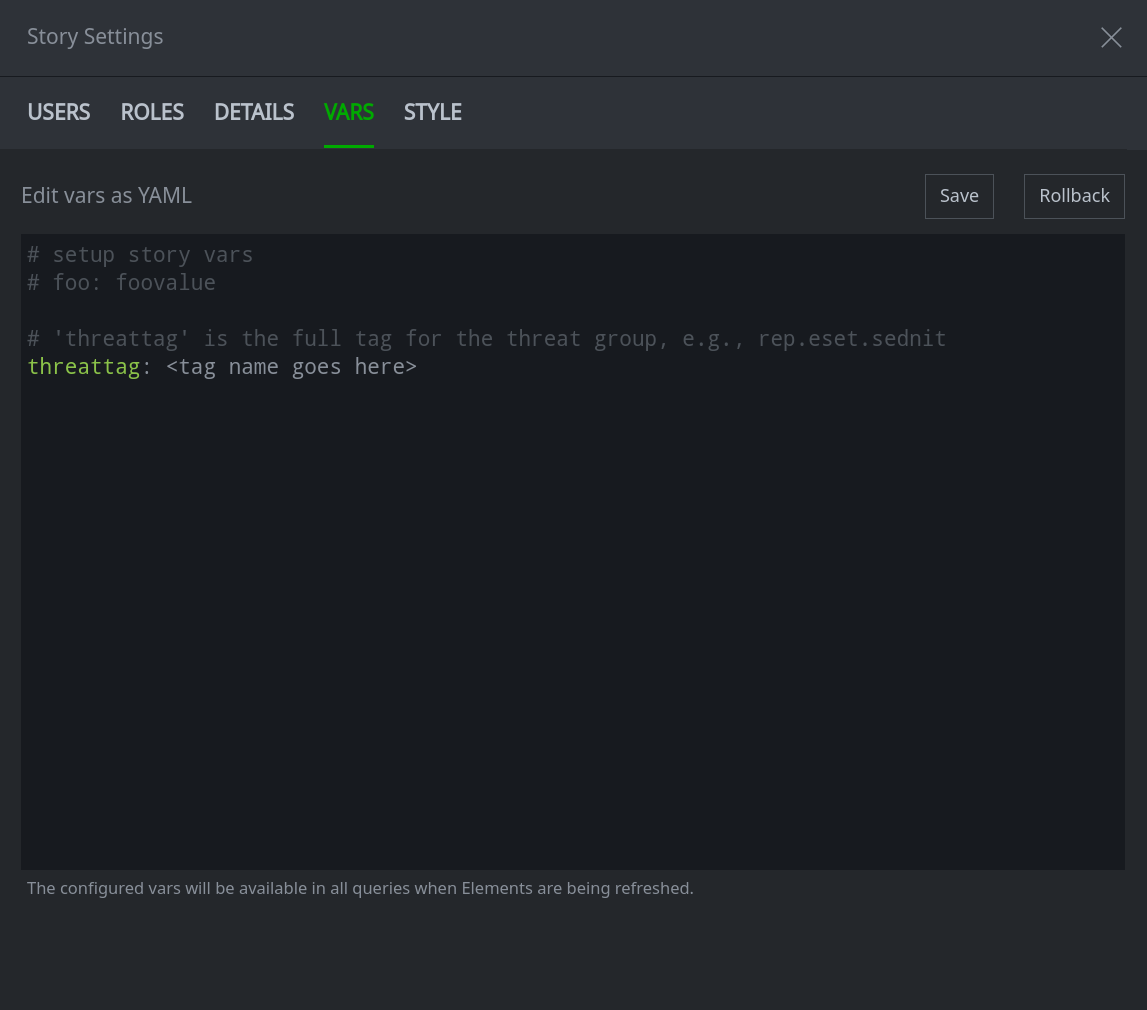
Click Save to save your changes. Click the X in the upper right to close the Story Settings dialog.
Tip
A detailed knowledge of Storm variables is generally not required to create and use a Story template. However, users who wish to learn more can refer to the Storm reference, specifically the section on variables.
Edit Your Storm Queries
Note
Complete the following steps for each template element that is generated by a Storm query.
Add the element you want to edit to the main Story body if it is not already there (see Add an Element to Your Story from the Clipboard).
Click the element’s edit icon to open it for editing. From the Story Details Panel, ELEMENT tab, click the Edit Query button to edit your Storm query (see Edit a Data Element).

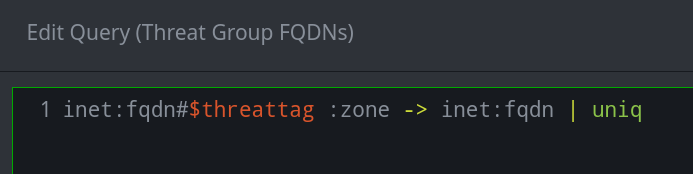
In the Edit Query dialog, replace the specific element you used to run the Storm query with the variable name you defined in the Story Settings dialog (see Create Your Variables). Be sure to include the dollar sign (
$) before your variable name.For example, if your data is generated from a Storm query that uses the threat group tag rep.eset.sedint and you defined the variable threattag to represent the tag name, replace the tag string with the variable:
Before:
After:
Click the Save button to save your changes.
Click the edit icon icon on the element to stop editing.
When you have finished editing all of your Storm queries to use your variable(s), your template is ready to use!
Tip
If you want others to be able to use your template, you will need to grant them access (see Give Others Access to Your Story). Granting read access (to users or roles) will allow them to view and copy the template, but not edit it. This can help prevent accidental changes to the template.
Use a Story Template to Create a Report
In the Stories Tool, locate the template you want to use. create a copy of the template (see Copy an Existing Story) so you do not overwrite the template. Open the copy.
Edit the title and description to reflect the Story you will create.
From the main Stories hamburger menu, select Story Settings.
In the Story Settings dialog, on the VARS tab, enter the specific value(s) to use for your variable(s) in order to generate the report. Click Save to save your changes, and X to close the Story Settings dialog.
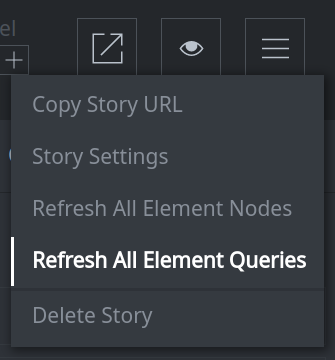
From the Story hamburger menu, select Refresh All Element Queries to re-run all of the Storm queries using the value(s) you specified for your variables.
Tip
Elements will be refreshed whether they are in the main Story body or the Clipboard. Depending on the number of Storm queries and the volume of data, it may take a bit of time to update all of the Story elements.
Once the refresh is complete, arrange the Story to your liking by:
Adding elements to the Story from the Clipboard and moving or resizing them (see Add an Element to Your Story from the Clipboard).
Sending elements you do not want to include to the Clipboard (see Send an Element to the Clipboard).
Editing any Markdown elements (e.g., to provide a custom summary of the report contents).
Export a Story as a PDF
In the Stories Tool, open the Story you wish to export (see Open a Story).
Tip
Before exporting your Story, ensure the elements are arranged to your liking. The Stories Tool uses a fixed grid layout and page breaks. Story elements cannot cross page breaks, and elements that support horizontal or vertical scroll within Synapse will only display content that is visible when they are exported.
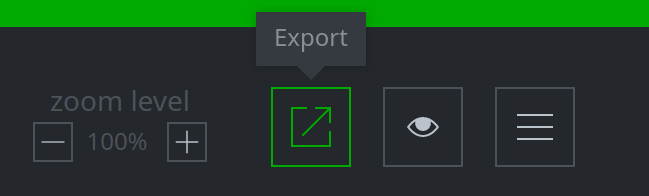
Click the Export icon above the Details Panel in your Story.
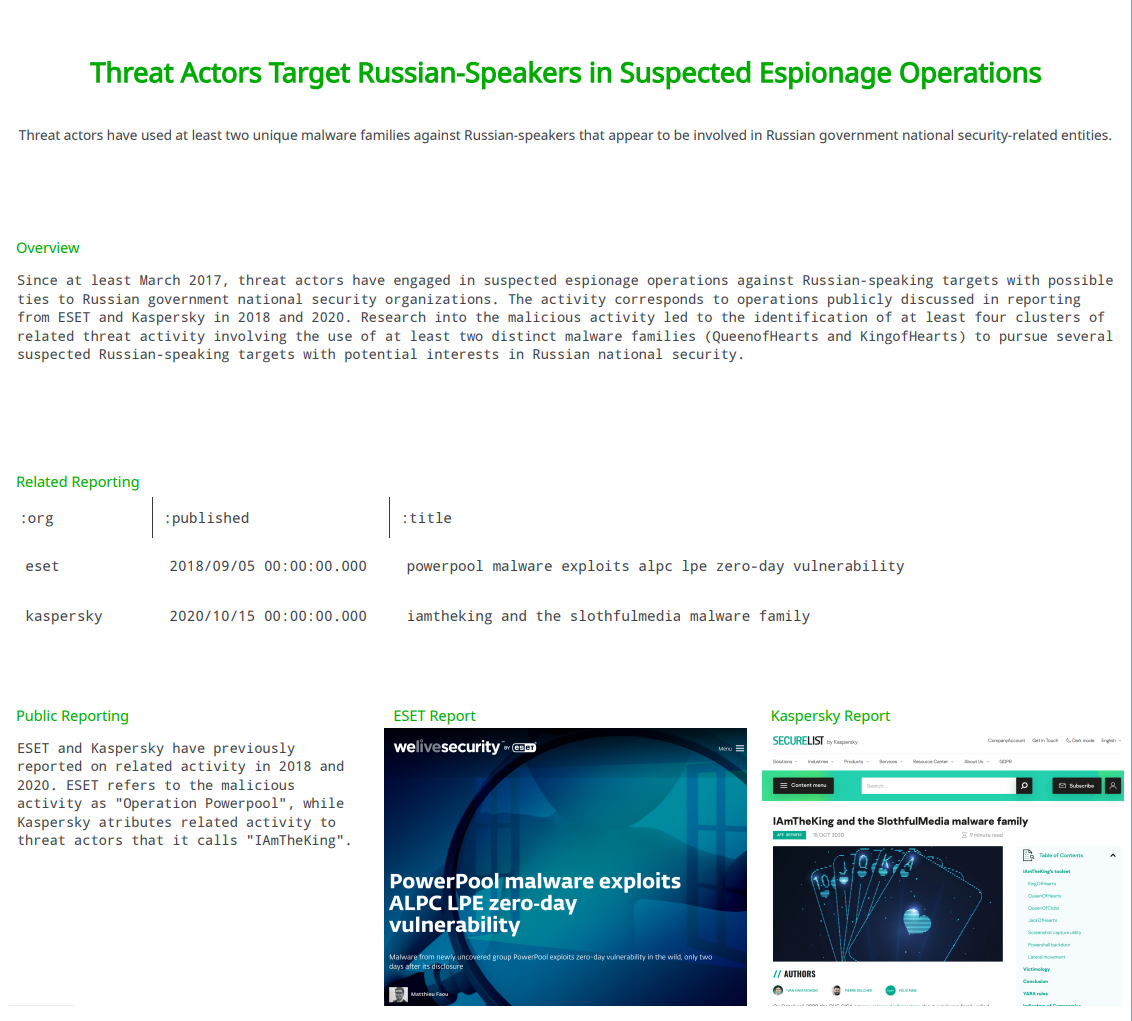
Preview your Story. If you need to modify the layout, click Cancel to return to the Story.
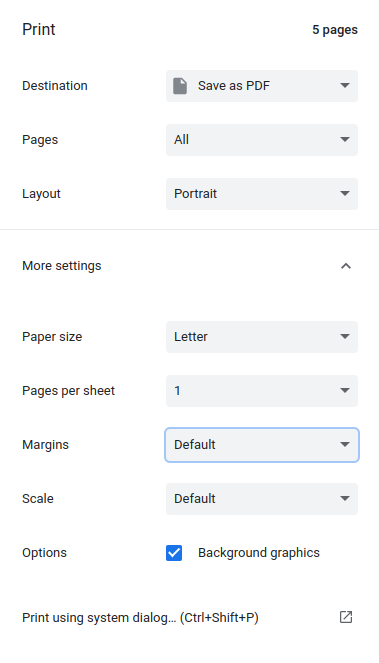
Use your browser’s Print options to make any adjustments. Select Save as PDF as the destination for the Story and click Save to export the Story as a PDF.
Note
Your print options may vary based on your specific browser and browser version.